

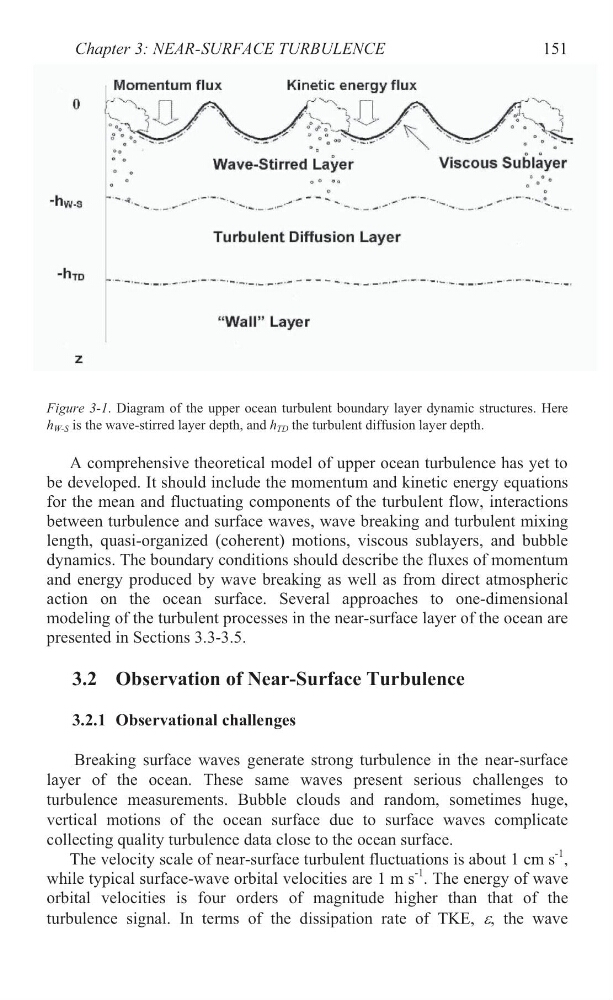
Figure 3-1. Diagram of the upper ocean turbulent boundary layer dynamic structures. Here
h W-S is the wave-stirred layer depth, and h TD the turbulent diffusion layer depth.
A comprehensive theoretical model of upper ocean turbulence has yet to
be developed. It should include the momentum and kinetic energy equations
for the mean and fluctuating components of the turbulent flow, interactions
between turbulence and surface waves, wave breaking and turbulent mixing
length, quasi-organized (coherent) motions, viscous sublayers, and bubble
dynamics. The boundary conditions should describe the fluxes of momentum
and energy produced by wave breaking as well as from direct atmospheric
action on the ocean surface. Several approaches to one-dimensional
modeling of the turbulent processes in the near-surface layer of the ocean are
presented in Sections 3.3-3.5.
3.2 Observation of Near-Surface Turbulence
3.2.1 Observational challenges
Breaking surface waves generate strong turbulence in the near-surface
layer of the ocean. These same waves present serious challenges to
turbulence measurements. Bubble clouds and random, sometimes huge,
vertical motions of the ocean surface due to surface waves complicate
collecting quality turbulence data close to the ocean surface.
The velocity scale of near-surface turbulent fluctuations is about 1 cm s
-1 ,
while typical surface-wave orbital velocities are 1 m s
-1 . The energy of wave
orbital velocities is four orders of magnitude higher than that of the
turbulence signal. In terms of the dissipation rate of TKE, H, the wave
Chapter 3: NEAR-SURFACE TURBULENCE
151
h W-S is the wave-stirred layer depth, and h TD the turbulent diffusion layer depth.
A comprehensive theoretical model of upper ocean turbulence has yet to
be developed. It should include the momentum and kinetic energy equations
for the mean and fluctuating components of the turbulent flow, interactions
between turbulence and surface waves, wave breaking and turbulent mixing
length, quasi-organized (coherent) motions, viscous sublayers, and bubble
dynamics. The boundary conditions should describe the fluxes of momentum
and energy produced by wave breaking as well as from direct atmospheric
action on the ocean surface. Several approaches to one-dimensional
modeling of the turbulent processes in the near-surface layer of the ocean are
presented in Sections 3.3-3.5.
3.2 Observation of Near-Surface Turbulence
3.2.1 Observational challenges
Breaking surface waves generate strong turbulence in the near-surface
layer of the ocean. These same waves present serious challenges to
turbulence measurements. Bubble clouds and random, sometimes huge,
vertical motions of the ocean surface due to surface waves complicate
collecting quality turbulence data close to the ocean surface.
The velocity scale of near-surface turbulent fluctuations is about 1 cm s
-1 ,
while typical surface-wave orbital velocities are 1 m s
-1 . The energy of wave
orbital velocities is four orders of magnitude higher than that of the
turbulence signal. In terms of the dissipation rate of TKE, H, the wave
Chapter 3: NEAR-SURFACE TURBULENCE
151