

Chapter 2: SEA SURFACE MICROLAYER
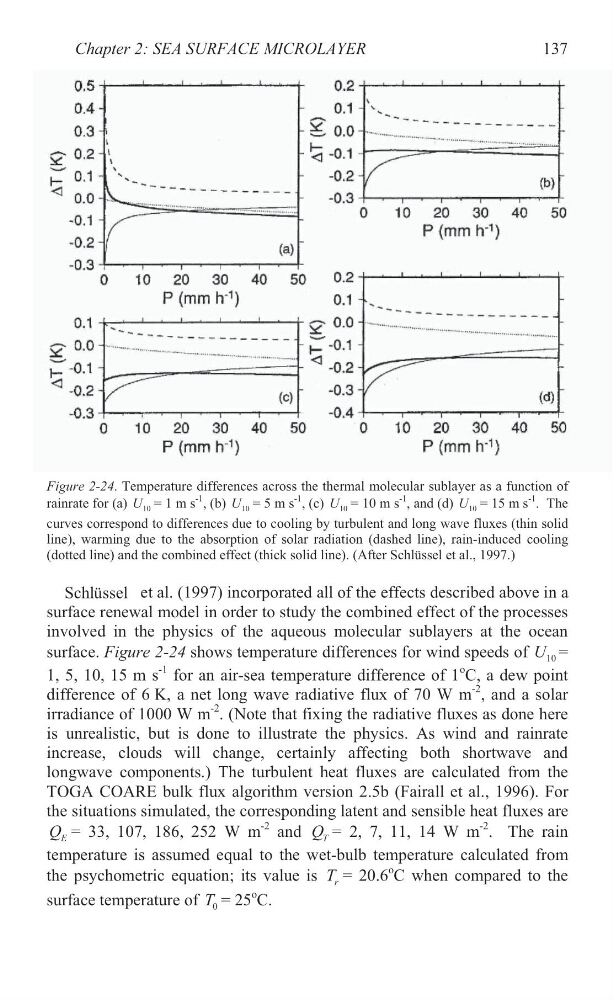
Figure 2-24. Temperature differences across the thermal molecular sublayer as a function of
rainrate for (a) 10
U = 1 m s
-1 , (b) 10
U = 5 m s
-1
, (c) 10
U = 10 m s
-1 , and (d) 10
U = 15 m s
-1 . The
curves correspond to differences due to cooling by turbulent and long wave fluxes (thin solid
line), warming due to the absorption of solar radiation (dashed line), rain-induced cooling
(dotted line) and the combined effect (thick solid line). (After Schl ssel et al., 1997.)
et al. (1997) incorporated all of the effects described above in a
surface renewal model in order to study the combined effect of the processes
involved in the physics of the aqueous molecular sublayers at the ocean
surface. Figure 2-24 shows temperature differences for wind speeds of 10
U =
1, 5, 10, 15 m s
-1 for an air-sea temperature difference of 1
o C, a dew point
difference of 6 K, a net long wave radiative flux of 70 W m
-2 , and a solar
irradiance of 1000 W m
-2 . (Note that fixing the radiative fluxes as done here
is unrealistic, but is done to illustrate the physics. As wind and rainrate
increase, clouds will change, certainly affecting both shortwave and
longwave components.) The turbulent heat fluxes are calculated from the
TOGA COARE bulk flux algorithm version 2.5b (Fairall et al., 1996). For
the situations simulated, the corresponding latent and sensible heat fluxes are
E
Q = 33, 107, 186, 252 W m
-2 and T
Q = 2, 7, 11, 14 W m
-2 . The rain
temperature is assumed equal to the wet-bulb temperature calculated from
the psychometric equation; its value is r
T = 20.6
o C when compared to the
surface temperature of 0
T = 25
o C.
137
ü
Schl ssel
ü
Figure 2-24. Temperature differences across the thermal molecular sublayer as a function of
rainrate for (a) 10
U = 1 m s
-1 , (b) 10
U = 5 m s
-1
, (c) 10
U = 10 m s
-1 , and (d) 10
U = 15 m s
-1 . The
curves correspond to differences due to cooling by turbulent and long wave fluxes (thin solid
line), warming due to the absorption of solar radiation (dashed line), rain-induced cooling
(dotted line) and the combined effect (thick solid line). (After Schl ssel et al., 1997.)
et al. (1997) incorporated all of the effects described above in a
surface renewal model in order to study the combined effect of the processes
involved in the physics of the aqueous molecular sublayers at the ocean
surface. Figure 2-24 shows temperature differences for wind speeds of 10
U =
1, 5, 10, 15 m s
-1 for an air-sea temperature difference of 1
o C, a dew point
difference of 6 K, a net long wave radiative flux of 70 W m
-2 , and a solar
irradiance of 1000 W m
-2 . (Note that fixing the radiative fluxes as done here
is unrealistic, but is done to illustrate the physics. As wind and rainrate
increase, clouds will change, certainly affecting both shortwave and
longwave components.) The turbulent heat fluxes are calculated from the
TOGA COARE bulk flux algorithm version 2.5b (Fairall et al., 1996). For
the situations simulated, the corresponding latent and sensible heat fluxes are
E
Q = 33, 107, 186, 252 W m
-2 and T
Q = 2, 7, 11, 14 W m
-2 . The rain
temperature is assumed equal to the wet-bulb temperature calculated from
the psychometric equation; its value is r
T = 20.6
o C when compared to the
surface temperature of 0
T = 25
o C.
137
ü
Schl ssel
ü