

62 George L. Mellor, Sirpa M. Hiikkinen, Tai Ezer and Richard C. Patchen
.,
~
6~
60
55
50
45
.0
35
30
25
20
15
10
85
60
55
50
45
40
~
3~
~ 30
2~
20
15
10
~
o
A
5
10
15
20
25
30
35
40
45
50
l.ONCITUDE
B
'"
2&'
.3\
~
~
~f(fr
~"""-Q-Ll
3600
0111
307.
o
10
15
20
25
30
35
40
45
50
LONGITUDE
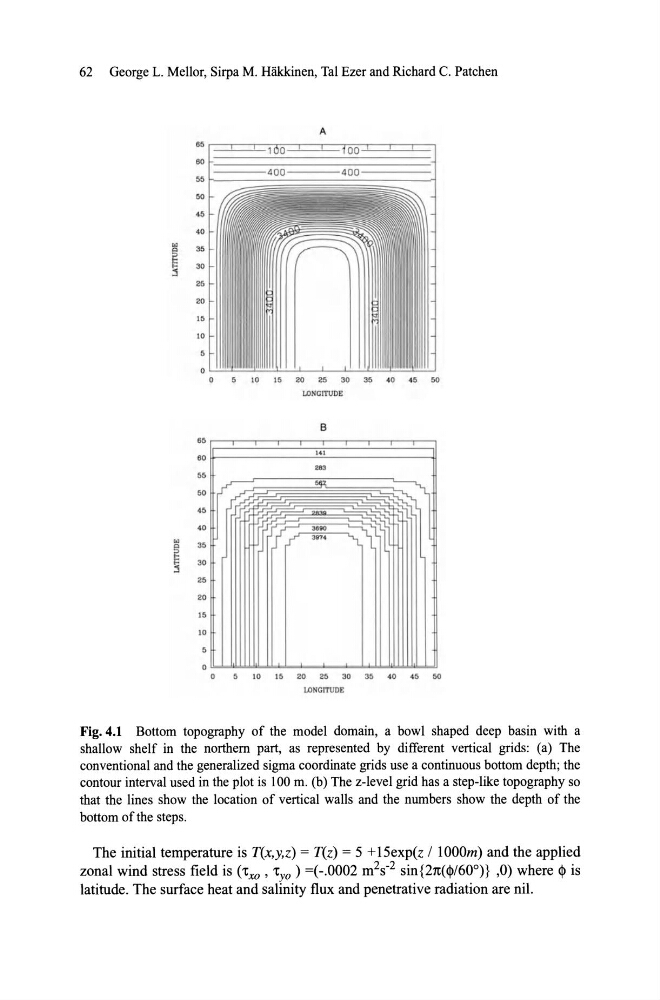
Fig. 4.1 Bottom topography of the model domain, a bowl shaped deep basin with a
shallow shelf in the northern part, as represented by different vertical grids: (a) The
conventional and the generalized sigma coordinate grids use a continuous bottom depth; the
contour interval used in the plot is 100 m. (b) The z-Ievel grid has a step-like topography so
that the lines show the location of vertical walls and the numbers show the depth of the
bottom ofthe steps.
The initial temperature is T(x,y,z) = T(z) = 5 + 15exp(z / 1000m) and the applied
zonal wind stress field is ('t xo ' 'tyo) =(-.0002 m 2 s- 2 sin{27t(<»/600)} ,0) where <» is
latitude. The surface heat and salinity flux and penetrative radiation are nil.
.,
~
6~
60
55
50
45
.0
35
30
25
20
15
10
85
60
55
50
45
40
~
3~
~ 30
2~
20
15
10
~
o
A
5
10
15
20
25
30
35
40
45
50
l.ONCITUDE
B
'"
2&'
.3\
~
~
~f(fr
~"""-Q-Ll
3600
0111
307.
o
10
15
20
25
30
35
40
45
50
LONGITUDE
Fig. 4.1 Bottom topography of the model domain, a bowl shaped deep basin with a
shallow shelf in the northern part, as represented by different vertical grids: (a) The
conventional and the generalized sigma coordinate grids use a continuous bottom depth; the
contour interval used in the plot is 100 m. (b) The z-Ievel grid has a step-like topography so
that the lines show the location of vertical walls and the numbers show the depth of the
bottom ofthe steps.
The initial temperature is T(x,y,z) = T(z) = 5 + 15exp(z / 1000m) and the applied
zonal wind stress field is ('t xo ' 'tyo) =(-.0002 m 2 s- 2 sin{27t(<»/600)} ,0) where <» is
latitude. The surface heat and salinity flux and penetrative radiation are nil.