

Primitive Equation Modelling of Plankton Ecosystems
419
vations. The model is said to have been verified if there is no statistically significant difference between simu1ation and observation. In that case it is impossib1e to
claim that the simulation could not have been observed, given the uncertainties in
the data set based on observations (attributable to the instruments, data processing
and inadequate sampling). The observations have then failed to reveal that the
model is deficient, at least in its ability to simulate the feature chosen for comparison. The model has survived to fight another day, until more challenging observations are available, either to repeat the test for that feature, or to perform a similar
test for some other feature .
5
WB modtl
4.5
4
3.5
ii
c 0)1 3
·w
.. =
~ 2.5
e c
~
2
...
O
1.S
0.5
o
JO
60
90
120
150
Day
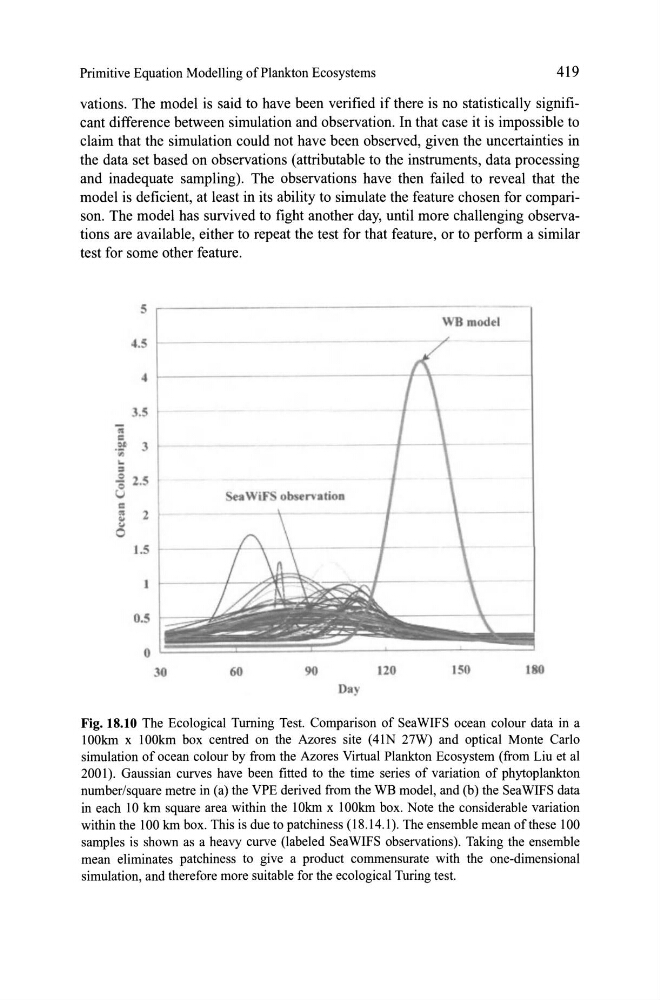
Fig. 18.10 The Ecological Tuming Test. Comparison of SeaWIFS ocean colour data in a
100km x 100km box centred on the Azores site (41N 27W) and optical Monte Carlo
simulation of ocean colour by from the Azores Virtual Plankton Ecosystem (fi-om Liu et al
2001). Gaussian curves have been fitted to the time series of variat ion of phytoplankton
number/square metre in (a) the VPE derived from the WB model, and (b) the SeaWIFS data
in each 10 km square area within the IOkm x 100km box. Note the considerable variation
within the 100 km box. This is due to patchiness (18.14.1). The ensemble mean of these 100
samples is shown as a heavy curve (Iabeled SeaWIFS observations). Taking the ensemble
mean eliminates patchiness to give a product commensurate with the one-dimensional
simulation, and therefore more suitable for the ecological Turing test.
419
vations. The model is said to have been verified if there is no statistically significant difference between simu1ation and observation. In that case it is impossib1e to
claim that the simulation could not have been observed, given the uncertainties in
the data set based on observations (attributable to the instruments, data processing
and inadequate sampling). The observations have then failed to reveal that the
model is deficient, at least in its ability to simulate the feature chosen for comparison. The model has survived to fight another day, until more challenging observations are available, either to repeat the test for that feature, or to perform a similar
test for some other feature .
5
WB modtl
4.5
4
3.5
ii
c 0)1 3
·w
.. =
~ 2.5
e c
~
2
...
O
1.S
0.5
o
JO
60
90
120
150
Day
Fig. 18.10 The Ecological Tuming Test. Comparison of SeaWIFS ocean colour data in a
100km x 100km box centred on the Azores site (41N 27W) and optical Monte Carlo
simulation of ocean colour by from the Azores Virtual Plankton Ecosystem (fi-om Liu et al
2001). Gaussian curves have been fitted to the time series of variat ion of phytoplankton
number/square metre in (a) the VPE derived from the WB model, and (b) the SeaWIFS data
in each 10 km square area within the IOkm x 100km box. Note the considerable variation
within the 100 km box. This is due to patchiness (18.14.1). The ensemble mean of these 100
samples is shown as a heavy curve (Iabeled SeaWIFS observations). Taking the ensemble
mean eliminates patchiness to give a product commensurate with the one-dimensional
simulation, and therefore more suitable for the ecological Turing test.