

Primitive Equation Modelling of Plankton Ecosystems
401
a)
3.SE+09
- .... -sudl
3.OE+09
____ d2
____ d3
'" 2.5E+09
_ _ ,..ed4
E
"'''''''' _dS
E
- - ... ed6
..
O 2.0E+09
__+__SC'ed 7
-
--SC'edll
~
.. 1.5E+09
..
.I::
E
=
Z 1.0E+09
5.0E+OO
...•....
O.OE+OO
6
8
10
12
14
16
18 20
22
24
26 28 30 32
34
Delta E in Micro .Julcs
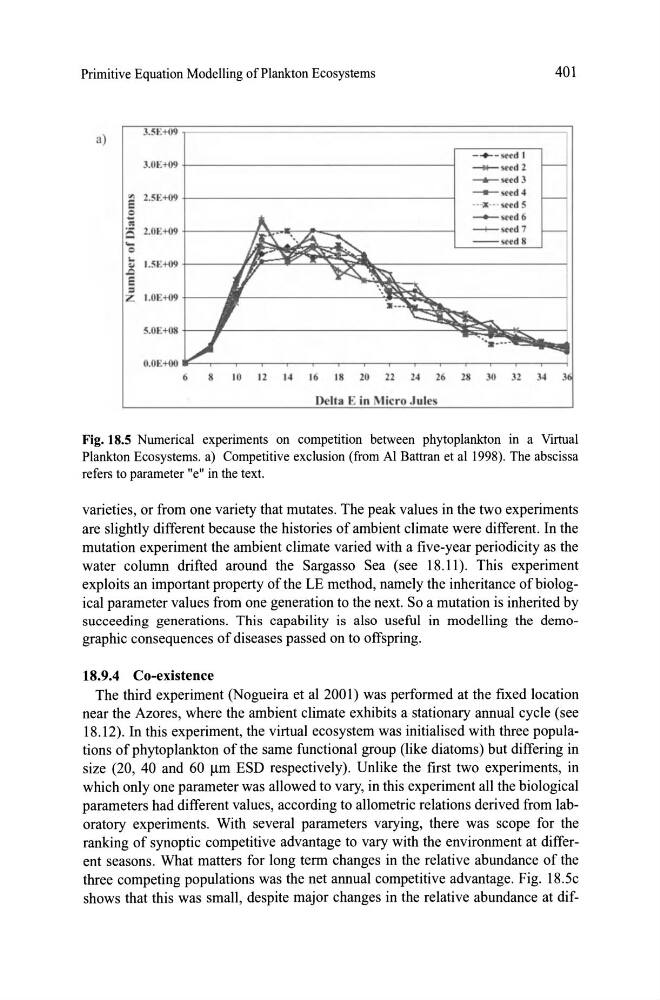
Fig. 18.5 Numerical experiments on competition between phytoplankton in a Virtual
Plankton Ecosystems. a) Competitive exclusion (from Al Battran et al 1998). The abscissa
refers to parameter "e" in the text.
varieties, or from one variety that mutates. The peak values in the two experiments
are slightly different because the histories of ambient c\imate were different. In the
mutation experiment the ambient c\imate varied with a five-year periodicity as the
water column drifted around the Sargasso Sea (see 18.11). This experiment
exploits an important property ofthe LE method, namely the inheritance of biological parameter values from one generation to the next. So a mutation is inherited by
succeeding generations. This capability is also useful in modeUing the demographic consequences of diseases pas sed on to offspring.
18.9.4 Co-existence
The third experiment (Nogueira et al 2001) was performed at the fixed location
near the Azores, where the ambient c\imate exhibits a stationary annual cyc\e (see
18.12). In this experiment, the virtual ecosystem was initialised with three populations ofphytoplankton ofthe same functional group (like diatoms) but differing in
size (20, 40 and 60 ~m ESD respectively). Unlike the first two experiments, in
which only one parameter was allowed to vary, in this experiment ali the biological
parameters had different values, according to allometric relations derived from laboratory experiments. With several parameters varying, there was scope for the
ranking of synoptic competitive advantage to vary with the environment at different seasons. What matters for long term changes in the relative abundance of the
three competing populations was the net annual competitive advantage. Fig. 18.5c
shows that this was small, despite major changes in the relative abundance at dif-
401
a)
3.SE+09
- .... -sudl
3.OE+09
____ d2
____ d3
'" 2.5E+09
_ _ ,..ed4
E
"'''''''' _dS
E
- - ... ed6
..
O 2.0E+09
__+__SC'ed 7
-
--SC'edll
~
.. 1.5E+09
..
.I::
E
=
Z 1.0E+09
5.0E+OO
...•....
O.OE+OO
6
8
10
12
14
16
18 20
22
24
26 28 30 32
34
Delta E in Micro .Julcs
Fig. 18.5 Numerical experiments on competition between phytoplankton in a Virtual
Plankton Ecosystems. a) Competitive exclusion (from Al Battran et al 1998). The abscissa
refers to parameter "e" in the text.
varieties, or from one variety that mutates. The peak values in the two experiments
are slightly different because the histories of ambient c\imate were different. In the
mutation experiment the ambient c\imate varied with a five-year periodicity as the
water column drifted around the Sargasso Sea (see 18.11). This experiment
exploits an important property ofthe LE method, namely the inheritance of biological parameter values from one generation to the next. So a mutation is inherited by
succeeding generations. This capability is also useful in modeUing the demographic consequences of diseases pas sed on to offspring.
18.9.4 Co-existence
The third experiment (Nogueira et al 2001) was performed at the fixed location
near the Azores, where the ambient c\imate exhibits a stationary annual cyc\e (see
18.12). In this experiment, the virtual ecosystem was initialised with three populations ofphytoplankton ofthe same functional group (like diatoms) but differing in
size (20, 40 and 60 ~m ESD respectively). Unlike the first two experiments, in
which only one parameter was allowed to vary, in this experiment ali the biological
parameters had different values, according to allometric relations derived from laboratory experiments. With several parameters varying, there was scope for the
ranking of synoptic competitive advantage to vary with the environment at different seasons. What matters for long term changes in the relative abundance of the
three competing populations was the net annual competitive advantage. Fig. 18.5c
shows that this was small, despite major changes in the relative abundance at dif-