

346 Nadia Pinardi et al.
a)
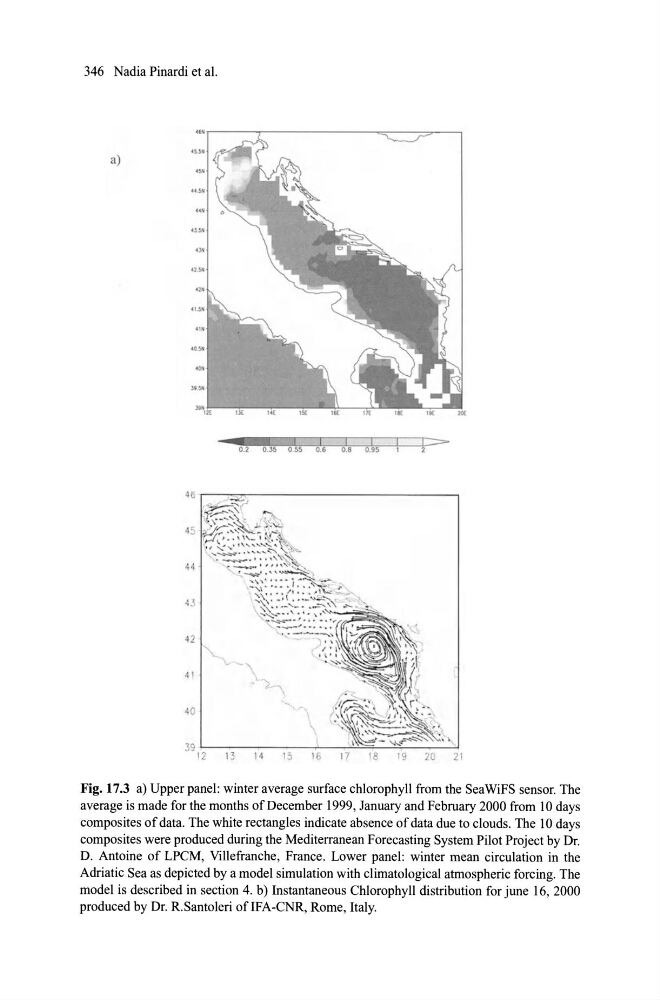
Fig. 17.3 a) Upper panel: winter average surf ace chlorophyll from the SeaWiFS sensor. The
average is made for the months of December 1999, January and February 2000 from 10 days
composites of data. The white rectangles indicate absence of data due to c\ouds. The 10 days
composites were produced during the Mediterranean Forecasting System Pilot Project by Dr.
D. Antoine of LPCM, Villefranche, France. Lower panel: winter mean circulation in the
Adriatic Sea as depicted by a model simulation with c\imatological atmospheric forcing. The
model is described in section 4. b) Instantaneous Chlorophyll distribution for june 16, 2000
produced by Dr. R.Santoleri ofIFA-CNR, Rome, Italy.
a)
Fig. 17.3 a) Upper panel: winter average surf ace chlorophyll from the SeaWiFS sensor. The
average is made for the months of December 1999, January and February 2000 from 10 days
composites of data. The white rectangles indicate absence of data due to c\ouds. The 10 days
composites were produced during the Mediterranean Forecasting System Pilot Project by Dr.
D. Antoine of LPCM, Villefranche, France. Lower panel: winter mean circulation in the
Adriatic Sea as depicted by a model simulation with c\imatological atmospheric forcing. The
model is described in section 4. b) Instantaneous Chlorophyll distribution for june 16, 2000
produced by Dr. R.Santoleri ofIFA-CNR, Rome, Italy.