

On North Atlantic lntedecadal Variability: A Stochastic View
Ensemble Trajectorres
NOrm. Ensemble Variance
0.5
-20 '--2-"-O~-22LO~- 2.J... 30-o-J 240
0.0 '-2 ~1':-O -~ 22O -~- 23--0~--.J240
-10
time
time
2.0 r---r-----,,-----r----,
1.5
1.0 f - --::::_ - - -.... F\-l
630
1.S
540
tim.
650
660
1.0 f - ---::;A----.--...rI
0.5
-20 '---'-------'-~.....=
0.0 t.....s::.'--_'--_--'-~---..l
620
630
640
650
620
630
540
650
time
Urne
1 : a~I~~ _ . . _ _ . _ . . . . _ _ . .. . . . .
-10
1.5
-'--1
0 .5
-20 L---'--~_L-~-'-_~
0 .0 ;.JI.~~_'--~--'-~--.J
220
230
240
250
220
230
240
250
time
time
173
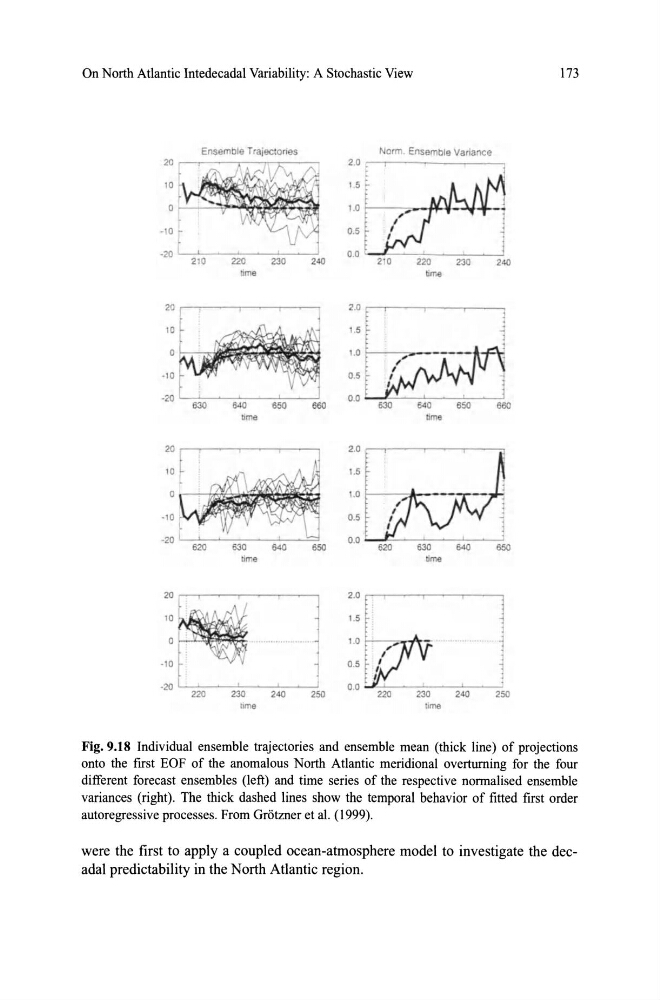
Fig. 9.18 Individual ensemble trajectories and ensemble mean (thick line) of projections
onto the frrst EOF of the anomalous North Atlantic meridional overtuming for the four
different forecast ensembles (left) and time series of the respective normalised ensemble
variances (right). The thick dashed lines show the temporal behavior of fitted first order
autoregressive processes. From Grotzner et al. (1999).
were the tirst to apply a coupled ocean-atmosphere model to investigate the decadal predictability in the North Atlantic region.
Ensemble Trajectorres
NOrm. Ensemble Variance
0.5
-20 '--2-"-O~-22LO~- 2.J... 30-o-J 240
0.0 '-2 ~1':-O -~ 22O -~- 23--0~--.J240
-10
time
time
2.0 r---r-----,,-----r----,
1.5
1.0 f - --::::_ - - -.... F\-l
630
1.S
540
tim.
650
660
1.0 f - ---::;A----.--...rI
0.5
-20 '---'-------'-~.....=
0.0 t.....s::.'--_'--_--'-~---..l
620
630
640
650
620
630
540
650
time
Urne
1 : a~I~~ _ . . _ _ . _ . . . . _ _ . .. . . . .
-10
1.5
-'--1
0 .5
-20 L---'--~_L-~-'-_~
0 .0 ;.JI.~~_'--~--'-~--.J
220
230
240
250
220
230
240
250
time
time
173
Fig. 9.18 Individual ensemble trajectories and ensemble mean (thick line) of projections
onto the frrst EOF of the anomalous North Atlantic meridional overtuming for the four
different forecast ensembles (left) and time series of the respective normalised ensemble
variances (right). The thick dashed lines show the temporal behavior of fitted first order
autoregressive processes. From Grotzner et al. (1999).
were the tirst to apply a coupled ocean-atmosphere model to investigate the decadal predictability in the North Atlantic region.