

On North Atlantic Intedecadal Variability: A Stochastic View
171
a)
correlolioD
' pure ' SlOChastic c1imaJe model
Iag
b)
e)
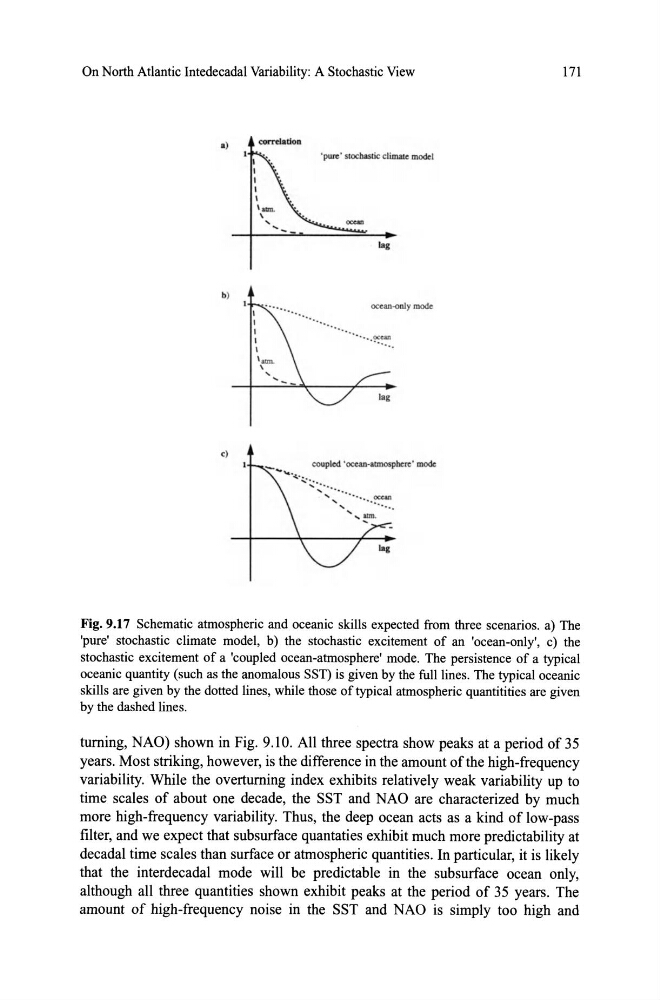
Fig. 9.17 Schematic atmospheric and oceanic skills expected from three scenarios. a) The
'pure' stochastic climate model, b) the stochastic excitement of an 'ocean-only', c) the
stochastic excitement of a 'coupled ocean-atmosphere' mode. The persistence of a typical
oceanic quantity (such as the anomalous SST) is given by the fulliines. The typical oceanic
skills are given by the dotted lines, while those of typical atmospheric quantitities are given
by the dashed lines.
tuming, NAO) shown in Fig. 9.10. AII three spectra show peaks at a period of35
years. Most striking, however, is the difference in the amount ofthe high-frequency
variability. While the overtuming index exhibits relatively weak variability up to
time scales of about one decade, the SST and NAO are characterized by much
more high-frequency variability. Thus, the deep ocean acts as a kind of low-pass
filter, and we expect that subsurface quantaties exhibit much more predictability at
decadal time scales than surface or atmospheric quantities. In particular, it is likely
that the interdecadal mode wilI be predictable in the subsurface ocean only,
although alI three quantities shown exhibit peaks at the period of 35 years. The
amount of high-frequency noi se in the SST and NAO is simply too high and
171
a)
correlolioD
' pure ' SlOChastic c1imaJe model
Iag
b)
e)
Fig. 9.17 Schematic atmospheric and oceanic skills expected from three scenarios. a) The
'pure' stochastic climate model, b) the stochastic excitement of an 'ocean-only', c) the
stochastic excitement of a 'coupled ocean-atmosphere' mode. The persistence of a typical
oceanic quantity (such as the anomalous SST) is given by the fulliines. The typical oceanic
skills are given by the dotted lines, while those of typical atmospheric quantitities are given
by the dashed lines.
tuming, NAO) shown in Fig. 9.10. AII three spectra show peaks at a period of35
years. Most striking, however, is the difference in the amount ofthe high-frequency
variability. While the overtuming index exhibits relatively weak variability up to
time scales of about one decade, the SST and NAO are characterized by much
more high-frequency variability. Thus, the deep ocean acts as a kind of low-pass
filter, and we expect that subsurface quantaties exhibit much more predictability at
decadal time scales than surface or atmospheric quantities. In particular, it is likely
that the interdecadal mode wilI be predictable in the subsurface ocean only,
although alI three quantities shown exhibit peaks at the period of 35 years. The
amount of high-frequency noi se in the SST and NAO is simply too high and