

Atmospheric Data Assimilation and Quality Control
95
The most likely combination is for them both to be correct: the table shows
P(G l nG 2 )=.413. This is the SQC re suit. Note that the simplex-like search algorithm would not work in this case: if we start at G I nG 2 , both G I nG 2 and G I nG 2
are less likely, so we do not get to G I nG 2 .
To get the probabilities for IQC we have to sum rows and columns: the table
show P(G I )=.416, P(G 2 )=.604. So observation 1 probably has a gross error, and
observation 2 is probably correct. Note however that if we make these decisions
individually, and then draw the analysis assuming G I nG 2 , then we are choosing a
rather unlikely combination.
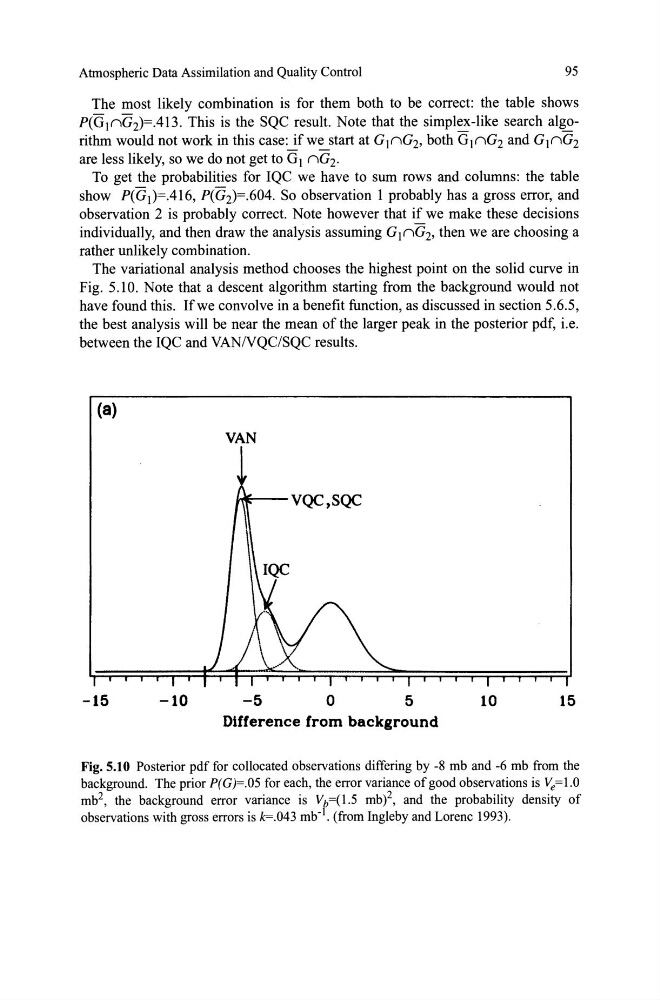
The variational analysis method chooses the highest point on the solid curve in
Fig. 5.10. Note that a descent algorithm starting from the background would not
have found this. Ifwe convolve in a benefit function, as discussed in section 5.6.5,
the best analysis will be near the mean of the larger peak in the posterior pdf, i.e.
between the IQC and VANNQC/SQC results.
(a)
VAN
~-vQC,SQC
-15
-10
-5
o
5
10
15
Difference from background
Fig. 5.10 Posterior pdf for collocated observations differing by -8 mb and -6 mb from the
background. The prior P(G)=.05 for each, the error variance of good observations is Ve=l.O
mb 2 , the background error variance is Vr(1.5 mb)2, and the probability density of
observations with gross errors is k=.043 mb- . (from Ingleby and Lorenc 1993).
95
The most likely combination is for them both to be correct: the table shows
P(G l nG 2 )=.413. This is the SQC re suit. Note that the simplex-like search algorithm would not work in this case: if we start at G I nG 2 , both G I nG 2 and G I nG 2
are less likely, so we do not get to G I nG 2 .
To get the probabilities for IQC we have to sum rows and columns: the table
show P(G I )=.416, P(G 2 )=.604. So observation 1 probably has a gross error, and
observation 2 is probably correct. Note however that if we make these decisions
individually, and then draw the analysis assuming G I nG 2 , then we are choosing a
rather unlikely combination.
The variational analysis method chooses the highest point on the solid curve in
Fig. 5.10. Note that a descent algorithm starting from the background would not
have found this. Ifwe convolve in a benefit function, as discussed in section 5.6.5,
the best analysis will be near the mean of the larger peak in the posterior pdf, i.e.
between the IQC and VANNQC/SQC results.
(a)
VAN
~-vQC,SQC
-15
-10
-5
o
5
10
15
Difference from background
Fig. 5.10 Posterior pdf for collocated observations differing by -8 mb and -6 mb from the
background. The prior P(G)=.05 for each, the error variance of good observations is Ve=l.O
mb 2 , the background error variance is Vr(1.5 mb)2, and the probability density of
observations with gross errors is k=.043 mb- . (from Ingleby and Lorenc 1993).