

Introduction
325
30
.
.
I
I
50
.
-
.
,
'
,
'
,
'
.
'
.
'
70
.
'
.
'
, ,
' . .
10
/
l
110
. .
E
, ,
'
I
~ 130
. ,
. ,
Q
.
,
150
'
•
/
,
'
170
'
'
I
'
,
I
1110
I
'
'
"
210
----- 280W
230
-140"W
250
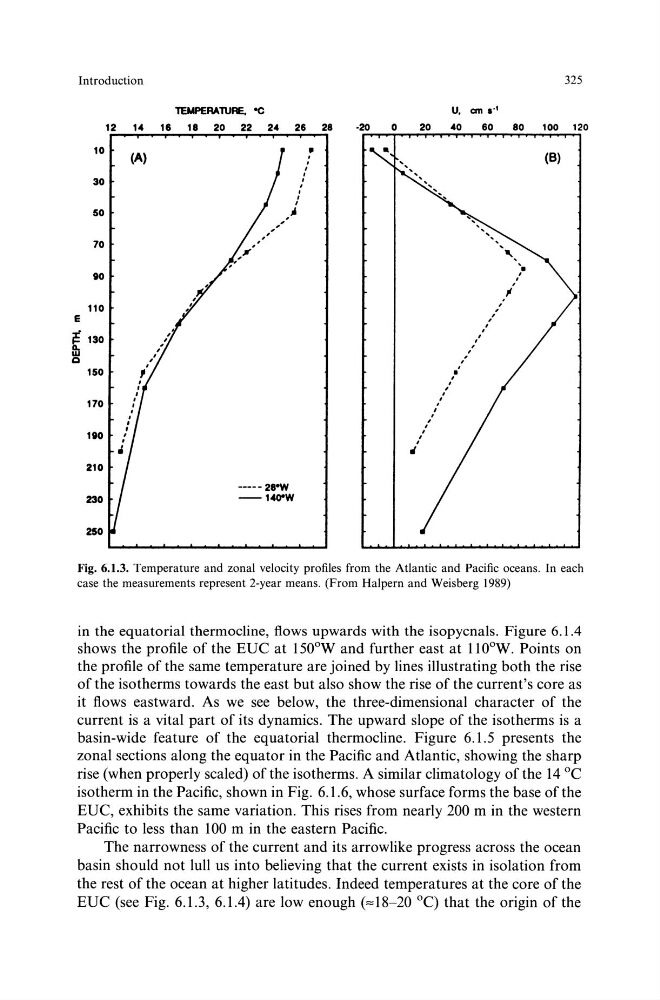
Fig. 6.1.3. Temperature and zonal velocity profiles from the Atlantic and Pacific oceans. In each
case the measurements represent 2-year means. (From Halpern and Weisberg 1989)
in the equatorial thermocline, flows upwards with the isopycnals. Figure 6.1.4
shows the profile of the EUC at 150°W and further east at 110°W. Points on
the profile of the same temperature are joined by lines illustrating both the rise
of the isotherms towards the east but also show the rise of the current's core as
it flows eastward. As we see below, the three-dimensional character of the
current is a vital part of its dynamics. The upward slope of the isotherms is a
basin-wide feature of the equatorial thermocline. Figure 6.1.5 presents the
zonal sections along the equator in the Pacific and Atlantic, showing the sharp
rise (when properly scaled) of the isotherms. A similar climatology of the 14 °C
isotherm in the Pacific, shown in Fig. 6.1.6, whose surface forms the base of the
EUC, exhibits the same variation. This rises from nearly 200 m in the western
Pacific to less than 100 m in the eastern Pacific.
The narrowness of the current and its arrow like progress across the ocean
basin should not lull us into believing that the current exists in isolation from
the rest of the ocean at higher latitudes. Indeed temperatures at the core of the
EUC (see Fig. 6.1.3, 6.1.4) are low enough (""18-20 °C) that the origin of the
325
30
.
.
I
I
50
.
-
.
,
'
,
'
,
'
.
'
.
'
70
.
'
.
'
, ,
' . .
10
/
l
110
. .
E
, ,
'
I
~ 130
. ,
. ,
Q
.
,
150
'
•
/
,
'
170
'
'
I
'
,
I
1110
I
'
'
"
210
----- 280W
230
-140"W
250
Fig. 6.1.3. Temperature and zonal velocity profiles from the Atlantic and Pacific oceans. In each
case the measurements represent 2-year means. (From Halpern and Weisberg 1989)
in the equatorial thermocline, flows upwards with the isopycnals. Figure 6.1.4
shows the profile of the EUC at 150°W and further east at 110°W. Points on
the profile of the same temperature are joined by lines illustrating both the rise
of the isotherms towards the east but also show the rise of the current's core as
it flows eastward. As we see below, the three-dimensional character of the
current is a vital part of its dynamics. The upward slope of the isotherms is a
basin-wide feature of the equatorial thermocline. Figure 6.1.5 presents the
zonal sections along the equator in the Pacific and Atlantic, showing the sharp
rise (when properly scaled) of the isotherms. A similar climatology of the 14 °C
isotherm in the Pacific, shown in Fig. 6.1.6, whose surface forms the base of the
EUC, exhibits the same variation. This rises from nearly 200 m in the western
Pacific to less than 100 m in the eastern Pacific.
The narrowness of the current and its arrow like progress across the ocean
basin should not lull us into believing that the current exists in isolation from
the rest of the ocean at higher latitudes. Indeed temperatures at the core of the
EUC (see Fig. 6.1.3, 6.1.4) are low enough (""18-20 °C) that the origin of the