

290
Buoyancy Forced Circulation and Cross-Gyre Flow
0
'
.____....
CIII/Ue
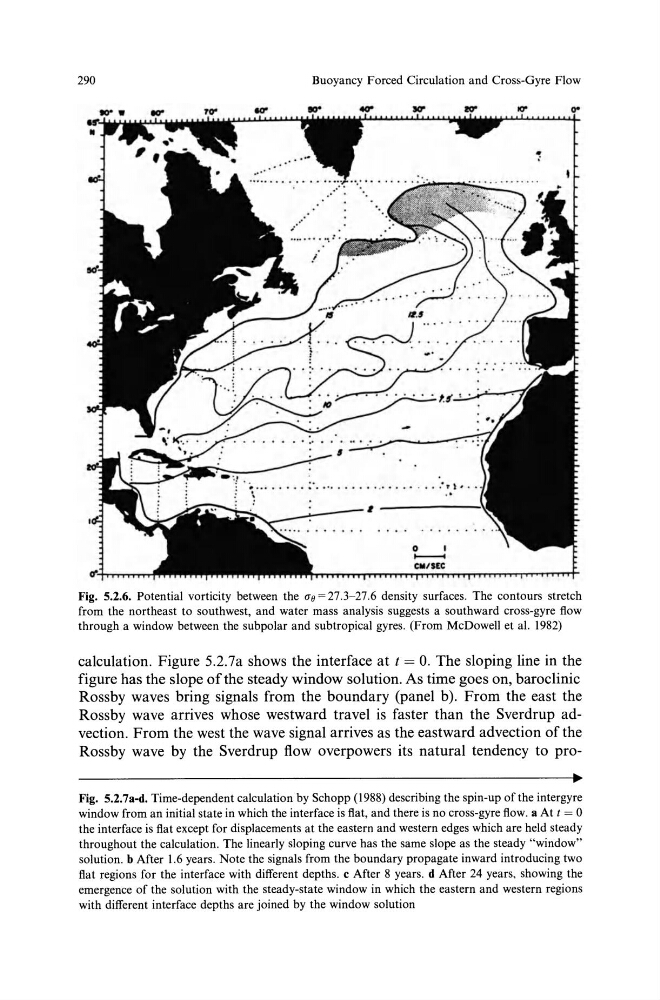
Fig. 5.2.6. Potential vorticity between the uo = 27.3-27.6 density surfaces. The contours stretch
from the northeast to southwest, and water mass analysis suggests a southward cross-gyre flow
through a window between the subpolar and subtropical gyres. (From McDowell et a!. 1982)
calculation. Figure 5.2.7a shows the interface at t = 0. The sloping line in the
figure has the slope of the steady window solution. As time goes on, baroclinic
Rossby waves bring signals from the boundary (panel b). From the east the
Rossby wave arrives whose westward travel is faster than the Sverdrup advection. From the west the wave signal arrives as the eastward advection of the
Rossby wave by the Sverdrup flow overpowers its natural tendency to proFig. 5.2.7a-d. Time-dependent calculation by Schopp (1988) describing the spin-up of the intergyre
window from an initial state in which the interface is fiat, and there is no cross-gyre flow. a At t = 0
the interface is fiat except for displacements at the eastern and western edges which are held steady
throughout the calculation. The linearly sloping curve has the same slope as the steady "window"
solution. b After 1.6 years. Note the signals from the boundary propagate inward introducing two
fiat regions for the interface with different depths. c After 8 years. d After 24 years, showing the
emergence of the solution with the steady-state window in which the eastern and western regions
with different interface depths are joined by the window solution
Buoyancy Forced Circulation and Cross-Gyre Flow
0
'
.____....
CIII/Ue
Fig. 5.2.6. Potential vorticity between the uo = 27.3-27.6 density surfaces. The contours stretch
from the northeast to southwest, and water mass analysis suggests a southward cross-gyre flow
through a window between the subpolar and subtropical gyres. (From McDowell et a!. 1982)
calculation. Figure 5.2.7a shows the interface at t = 0. The sloping line in the
figure has the slope of the steady window solution. As time goes on, baroclinic
Rossby waves bring signals from the boundary (panel b). From the east the
Rossby wave arrives whose westward travel is faster than the Sverdrup advection. From the west the wave signal arrives as the eastward advection of the
Rossby wave by the Sverdrup flow overpowers its natural tendency to proFig. 5.2.7a-d. Time-dependent calculation by Schopp (1988) describing the spin-up of the intergyre
window from an initial state in which the interface is fiat, and there is no cross-gyre flow. a At t = 0
the interface is fiat except for displacements at the eastern and western edges which are held steady
throughout the calculation. The linearly sloping curve has the same slope as the steady "window"
solution. b After 1.6 years. Note the signals from the boundary propagate inward introducing two
fiat regions for the interface with different depths. c After 8 years. d After 24 years, showing the
emergence of the solution with the steady-state window in which the eastern and western regions
with different interface depths are joined by the window solution