

a
Numerical and Observational Evidence
165
the potential vorticity is not homogenized. Ventilation of the density surface is
too strong at this level to allow homogenization to proceed.
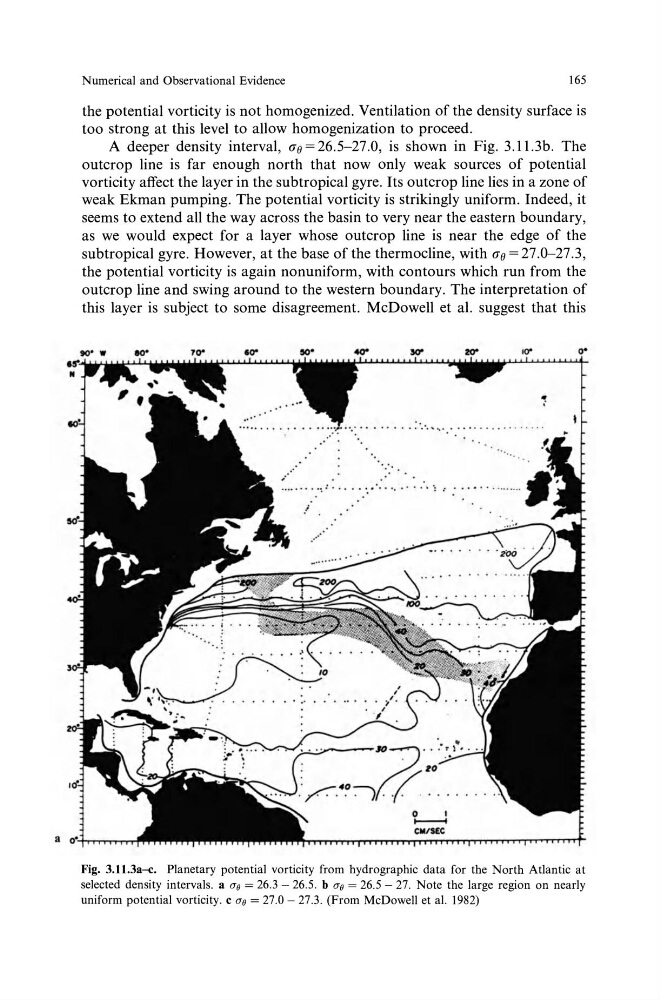
A deeper density interval, a0 = 26.5-27.0, is shown in Fig. 3. 11.3b. The
outcrop line is far enough north that now only weak sources of potential
vorticity affect the layer in the subtropical gyre. Its outcrop line lies in a zone of
weak Ekman pumping. The potential vorticity is strikingly uniform. Indeed, it
seems to extend all the way across the basin to very near the eastern boundary,
as we would expect for a layer whose outcrop line is near the edge of the
subtropical gyre. However, at the base of the thermocline, with ae = 27.0--27.3,
the potential vorticity is again nonuniform, with contours which run from the
outcrop line and swing around to the western boundary. The interpretation of
this layer is subject to some disagreement. McDowell et al. suggest that this
··.· .. . .. .. . : ·.· ... .. .. . . . ... ... . ... .
·.
.
.
.
.... . . .
. ·~ . ... . . · .• . . .. . . . . . : ..
. ····
0
I
-
CM.IKC
Fig. 3.11 .3a-c. Planetary potential vorticity from hydrographic data for the North Atlantic at
selected density intervals. a ao = 26.3 - 26.5. b ao = 26.5 - 27. Note the large region on nearly
uniform potential vorticity. c ao = 27.0 - 27.3. (From McDowell et al. 1982)
Numerical and Observational Evidence
165
the potential vorticity is not homogenized. Ventilation of the density surface is
too strong at this level to allow homogenization to proceed.
A deeper density interval, a0 = 26.5-27.0, is shown in Fig. 3. 11.3b. The
outcrop line is far enough north that now only weak sources of potential
vorticity affect the layer in the subtropical gyre. Its outcrop line lies in a zone of
weak Ekman pumping. The potential vorticity is strikingly uniform. Indeed, it
seems to extend all the way across the basin to very near the eastern boundary,
as we would expect for a layer whose outcrop line is near the edge of the
subtropical gyre. However, at the base of the thermocline, with ae = 27.0--27.3,
the potential vorticity is again nonuniform, with contours which run from the
outcrop line and swing around to the western boundary. The interpretation of
this layer is subject to some disagreement. McDowell et al. suggest that this
··.· .. . .. .. . : ·.· ... .. .. . . . ... ... . ... .
·.
.
.
.
.... . . .
. ·~ . ... . . · .• . . .. . . . . . : ..
. ····
0
I
-
CM.IKC
Fig. 3.11 .3a-c. Planetary potential vorticity from hydrographic data for the North Atlantic at
selected density intervals. a ao = 26.3 - 26.5. b ao = 26.5 - 27. Note the large region on nearly
uniform potential vorticity. c ao = 27.0 - 27.3. (From McDowell et al. 1982)