

2
Sverdrup Theory
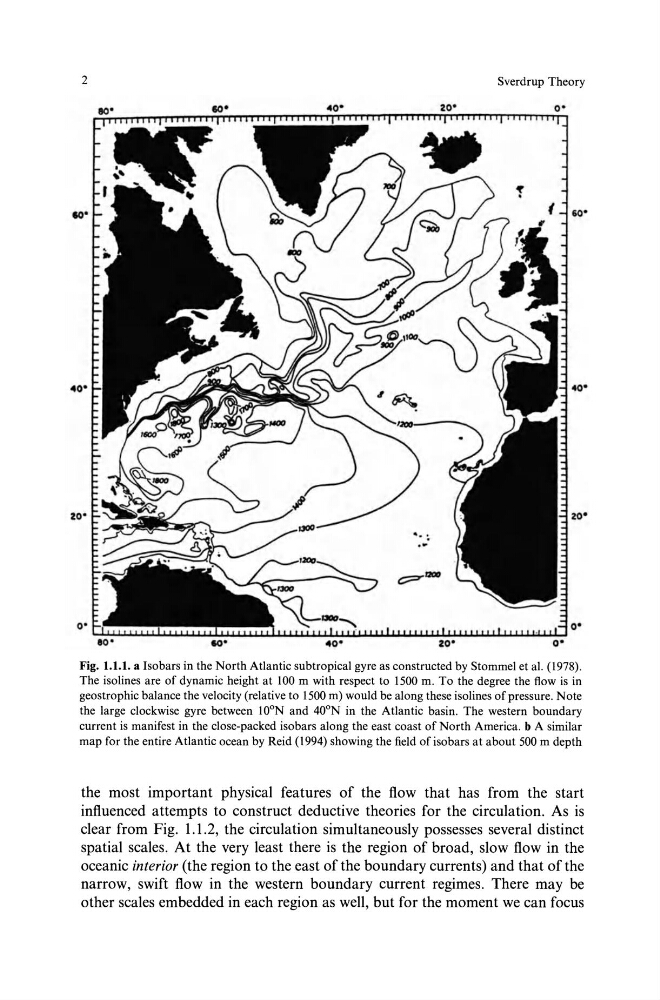
Fig. 1.1.1. a Isobars in the North Atlantic subtropical gyre as constructed by Stommel eta!. (1978).
The isolines are of dynamic height at 100m with respect to 1500 m. To the degree the flow is in
geostrophic balance the velocity (relative to 1500 m) would be along these isolines of pressure. Note
the large clockwise gyre between l0°N and 40°N in the Atlantic basin. The western boundary
current is manifest in the close-packed isobars along the east coast of North America. b A similar
map for the entire Atlantic ocean by Reid (1994) showing the field of isobars at about 500 m depth
the most important physical features of the flow that has from the start
influenced attempts to construct deductive theories for the circulation. As is
clear from Fig. 1.1 .2, the circulation simultaneously possesses several distinct
spatial scales. At the very least there is the region of broad, slow flow in the
oceanic interior (the region to the east of the boundary currents) and that of the
narrow, swift flow in the western boundary current regimes. There may be
other scales embedded in each region as well, but for the moment we can focus
Sverdrup Theory
Fig. 1.1.1. a Isobars in the North Atlantic subtropical gyre as constructed by Stommel eta!. (1978).
The isolines are of dynamic height at 100m with respect to 1500 m. To the degree the flow is in
geostrophic balance the velocity (relative to 1500 m) would be along these isolines of pressure. Note
the large clockwise gyre between l0°N and 40°N in the Atlantic basin. The western boundary
current is manifest in the close-packed isobars along the east coast of North America. b A similar
map for the entire Atlantic ocean by Reid (1994) showing the field of isobars at about 500 m depth
the most important physical features of the flow that has from the start
influenced attempts to construct deductive theories for the circulation. As is
clear from Fig. 1.1 .2, the circulation simultaneously possesses several distinct
spatial scales. At the very least there is the region of broad, slow flow in the
oceanic interior (the region to the east of the boundary currents) and that of the
narrow, swift flow in the western boundary current regimes. There may be
other scales embedded in each region as well, but for the moment we can focus