

Ocean Acoustic Tomography
127
-2
-10
-2
-8
-4
-4
-4
CTD I
(a)
(b)
66-85 76
-7
-5
-5
-5
-6
-6
-8
-8
-10
-12
82
88
-2
-4
-6
-8
-4
94
-2
0
-4
-6
-2
100
-1
-1
-3
-3
-5
-1
106
-4
-2
-2
-2
0
0
112
-2
-4
-4
-6
118
-6
-4
-2
-4
CTD II 120-139
-3
-3
-5
-5
-7
-1
1
1
S
R
R
R
R
R
S
S
S
300 km
300 km
30
10
20
30
20
10
–600
–400
–200
0
+200
+100
0
–100
+400
June
July 1981
(km)
south
north
τ (ms)
A
North Station
East
80°W
7 0 °
30°
N
20°
West
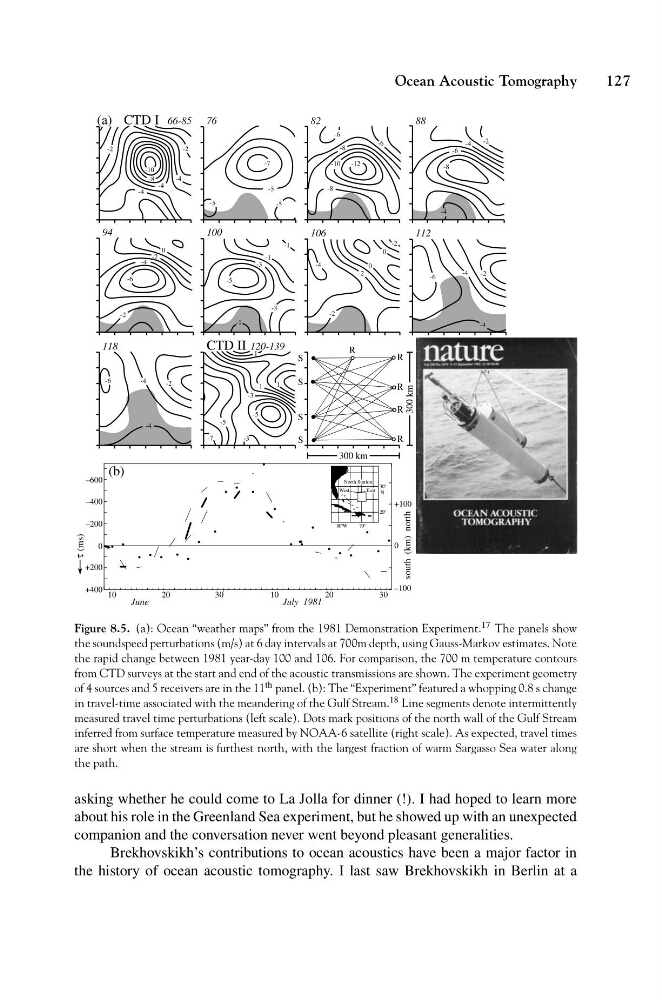
Figure 8.5. (a): Ocean “weather maps” from the 1981 Demonstration Experiment. 17 The panels show
the soundspeed perturbations (m/s) at 6 day intervals at 700m depth, using Gauss-Markov estimates. Note
the rapid change between 1981 year-day 100 and 106. For comparison, the 700 m temperature contours
from CTD surveys at the start and end of the acoustic transmissions are shown. The experiment geometry
of 4 sources and 5 receivers are in the 11 th panel. (b): The “Experiment” featured a whopping 0.8 s change
in travel-time associated with the meandering of the Gulf Stream. 18 Line segments denote intermittently
measured travel time perturbations (left scale). Dots mark positions of the north wall of the Gulf Stream
inferred from surface temperature measured by NOAA-6 satellite (right scale). As expected, travel times
are short when the stream is furthest north, with the largest fraction of warm Sargasso Sea water along
the path.
asking whether he could come to La Jolla for dinner (!). I had hoped to learn more
about his role in the Greenland Sea experiment, but he showed up with an unexpected
companion and the conversation never went beyond pleasant generalities.
Brekhovskikh’s contributions to ocean acoustics have been a major factor in
the history of ocean acoustic tomography. I last saw Brekhovskikh in Berlin at a
127
-2
-10
-2
-8
-4
-4
-4
CTD I
(a)
(b)
66-85 76
-7
-5
-5
-5
-6
-6
-8
-8
-10
-12
82
88
-2
-4
-6
-8
-4
94
-2
0
-4
-6
-2
100
-1
-1
-3
-3
-5
-1
106
-4
-2
-2
-2
0
0
112
-2
-4
-4
-6
118
-6
-4
-2
-4
CTD II 120-139
-3
-3
-5
-5
-7
-1
1
1
S
R
R
R
R
R
S
S
S
300 km
300 km
30
10
20
30
20
10
–600
–400
–200
0
+200
+100
0
–100
+400
June
July 1981
(km)
south
north
τ (ms)
A
North Station
East
80°W
7 0 °
30°
N
20°
West
Figure 8.5. (a): Ocean “weather maps” from the 1981 Demonstration Experiment. 17 The panels show
the soundspeed perturbations (m/s) at 6 day intervals at 700m depth, using Gauss-Markov estimates. Note
the rapid change between 1981 year-day 100 and 106. For comparison, the 700 m temperature contours
from CTD surveys at the start and end of the acoustic transmissions are shown. The experiment geometry
of 4 sources and 5 receivers are in the 11 th panel. (b): The “Experiment” featured a whopping 0.8 s change
in travel-time associated with the meandering of the Gulf Stream. 18 Line segments denote intermittently
measured travel time perturbations (left scale). Dots mark positions of the north wall of the Gulf Stream
inferred from surface temperature measured by NOAA-6 satellite (right scale). As expected, travel times
are short when the stream is furthest north, with the largest fraction of warm Sargasso Sea water along
the path.
asking whether he could come to La Jolla for dinner (!). I had hoped to learn more
about his role in the Greenland Sea experiment, but he showed up with an unexpected
companion and the conversation never went beyond pleasant generalities.
Brekhovskikh’s contributions to ocean acoustics have been a major factor in
the history of ocean acoustic tomography. I last saw Brekhovskikh in Berlin at a