

70'
50'
40'
30'
2()'
10'
- 10'
Reconstructing and Modelling the Last Glacial Maximum
o
\
. 2()' "--===--=::::JIII~<::::::::~--?=~-~~
3 10'
= ' 330 ' 340' 350' O' 10' 2()' 30'
707
10'
o·
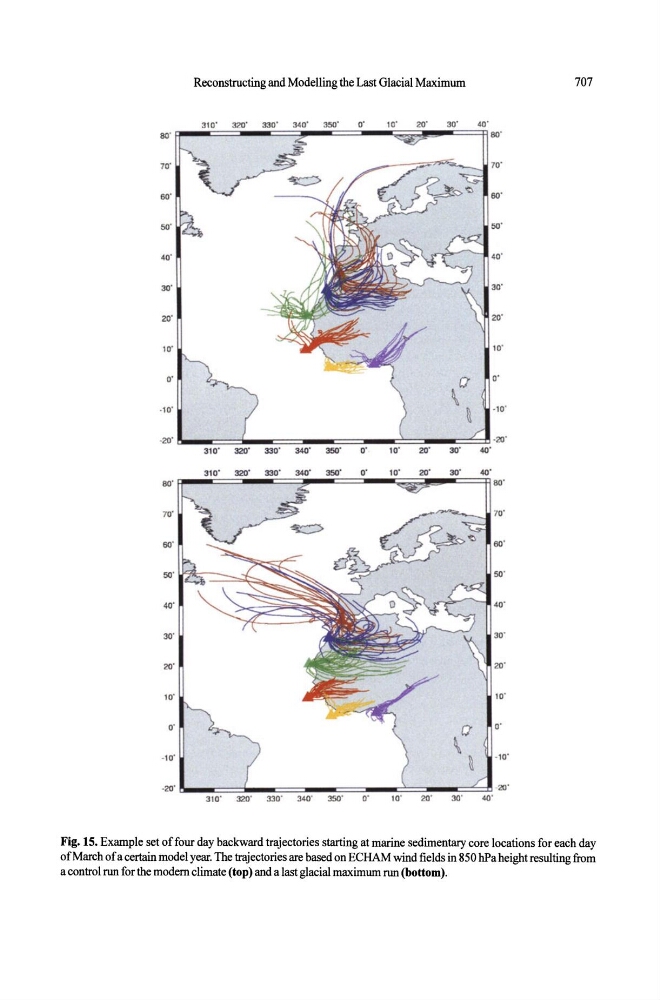
Fig. 15. Example set of four day backward trajectories starting at marine sedimentary core locations for each day
of March of a certain model year, The trajectories are based on ECHAM wind fields in 850 hPa height resulting from
a control run for the modem climate (top) and a last glacial maximum run (bottom),