

Reconstructing and Modelling the Last Glacial Maximum
693
LO,-C; 'TUO
2m temperatur e ( C ) . LG "I n1 i n. us
antra l
ONG'T DE
t ndard deviation (C) . LG M run
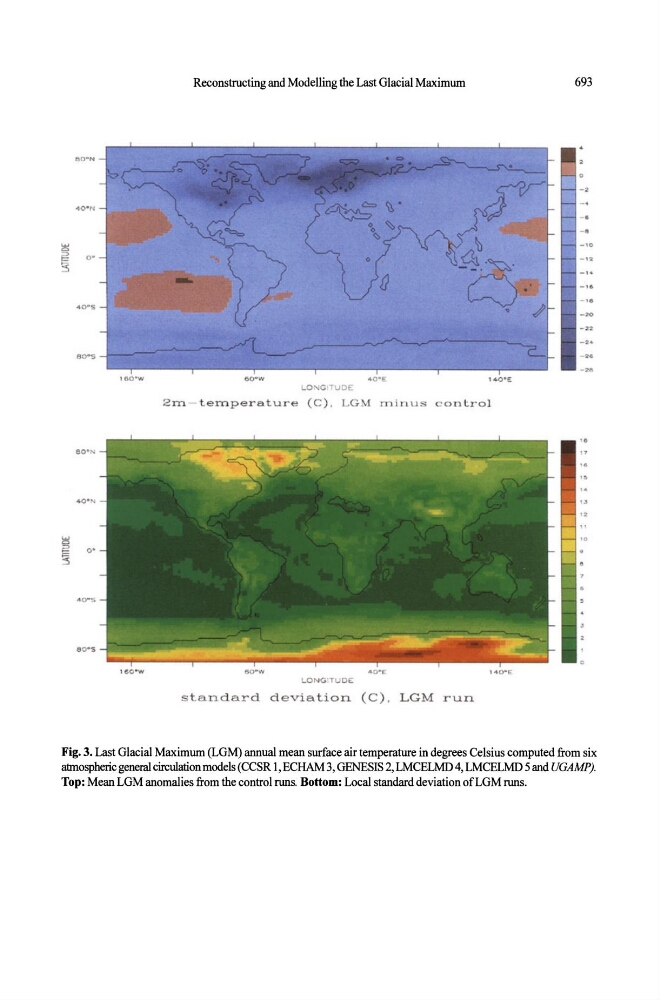
Fig. 3. Last Glacial Maximum (LGM) annual mean surface air temperature in degrees Celsius computed from six
atmospheric general circulation models (CCSR 1, ECHAM 3, GENESIS 2, LMCELMD 4, LMCELMD 5 and UGAMP).
Top: Mean LGM anomalies from the control runs. Bottom: Local standard deviation ofLGM runs.