

Simulation of Oxygen Isotopes in a Global Ocean Model
677
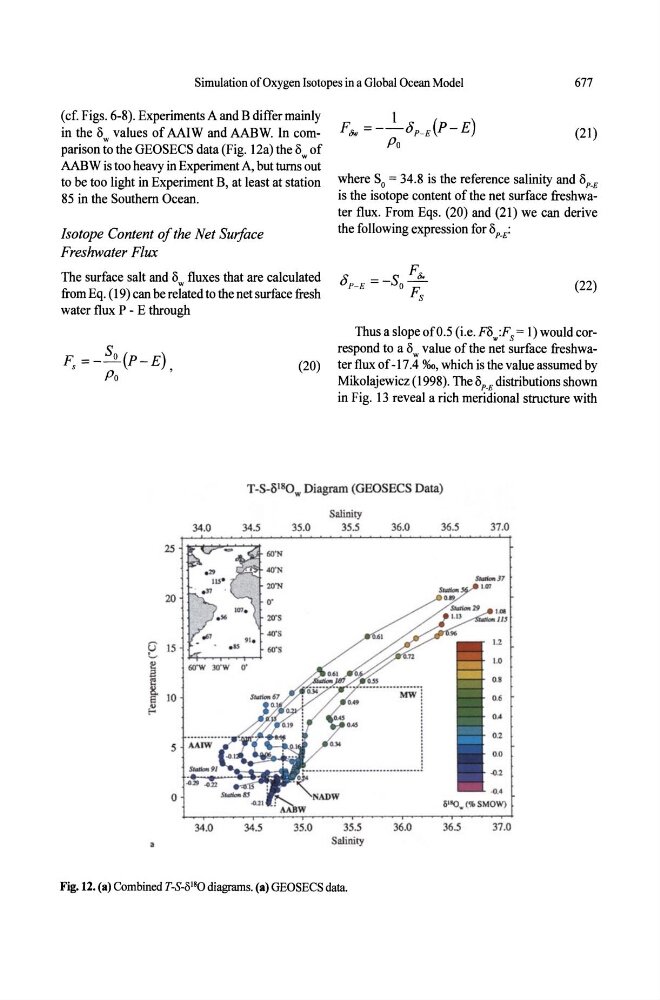
(cf. Figs. 6-8). Experiments A and B differ mainly
in the ° values of AAIW and AABW. In comw
parison to the GEOSECS data (Fig. l2a) the Ow of
AABW is too heavy in Experiment A, but turns out
to be too light in Experiment B, at least at station
85 in the Southern Ocean.
Isotope Content of the Net Surface
Freshwater Flux
The surface salt and Ow fluxes that are calculated
from Eq. (19) can be related to the net surface fresh
water flux P - E through
(21)
where So = 34.8 is the reference salinity and 8P-E
is the isotope content of the net surface freshwater flux. From Eqs. (20) and (21) we can derive
the following expression for 0P-E:
(22)
Fs=-SO(P_E} ,
Po
Thus a slope of 0.5 (i.e. FO,, :F s = 1) would correspond to a Ow value of the net surface freshwa(20) ter flux of -17.4 0/00, which is the value assumed by
Mikolajewicz (1998). The ° P-E distributions shown
in Fig. 13 reveal a rich meridional structure with
T-S-OI80 w Diagram (GEOSECS Data)
Salinity
34.0
34.S
3S.0
355
36.0
36.5
37.0
25
1SO·t;
4O"N
_ J 7
201'1
U"
20
....
/IS
E
IS
~
[ 10
~
S AAIW
_ 9 1
0
34.0
34.5
35.0
35.5
36.0
36.5
37.0
Salinity
Fig. 12. (a) Combined T-S-OI80 diagrams. (a) GEOSECS data.