

Simulation of Oxygen Isotopes in a Global Ocean Model
MW
AAIW
NADW
Temperature range (0C)
2.6-11.0
2.0-6.0
1.5-4.0
Salinity range (%0)
35.0-36.2
33.8-34.8
34.8-35 .0
Oxygen-I 8 range (%0 SMOW)
0.26-0.54
-0.29-0.18
0.05-0.31
Oxygen-I 8 mean value (%0 SMOW)
0.36
0.00
0.20
Oxygen-18 standard deviation (%0 SMOW)
0.08
0.09
0.06
Oxygen-I 8 nwnber of samples
19
34
64
675
AABW
-0.9-1.7
34.64-34.72
-0.27-0.04
-0.12
0.07
77
Table 2. Temperature, salinity and oxygen-I 8 characteristics of Mediterranean Water (MW), Antarctic Intermediate Water (AAIW), North Atlantic Deep Water (NADW) and Antarctic Bottom Water (AABW). The temperature
and salinity ranges are as defmed by Emery and Meincke (1986). The oxygen-I 8 statistics is computed for the serial
points from all GEOSECS stations in the Atlantic that fall into these temperature-salinity ranges.
0
4.5
200
4.25
~
4
E 400
3.75
I
.....
3.5
0..
600
w
0
3.25
800
3
000
2.75
0
25
1000
2.25
2
~ 2000
1.75
...s
1.5
I
3000
1.25
.....
a
w
0
4000
0.75
0
5000
0.25
0
- 60
- 30
0
30
60
90
LATlTuO -
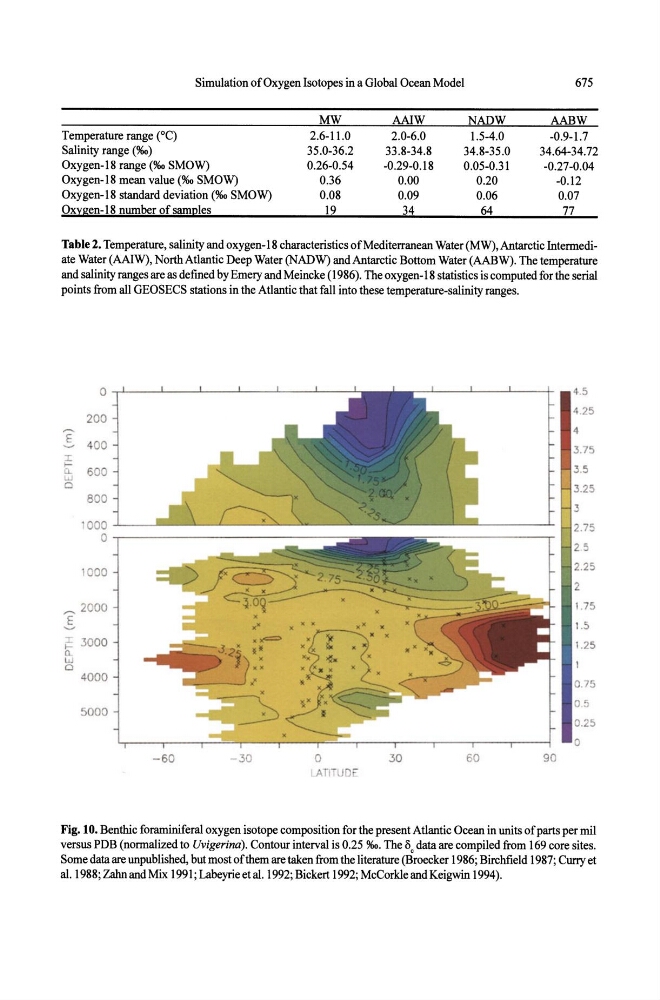
Fig. to. Benthic foraminiferal oxygen isotope composition for the present Atlantic Ocean in units of parts per mil
versus PDB (normalized to Uvigerina) . Contour interval is 0.25 %0. The 1\ data are compiled from 169 core sites.
Some data are unpublished, but most of them are taken from the literature (Broecker 1986; Birchfield 1987; Curry et
al. 1988; Zahn and Mix 1991 ; Labeyrie et al. 1992; Bickert 1992; McCorkle and Keigwin 1994).