

Simulation of Oxygen Isotopes in a Global Ocean Model
673
C
200
,S <00
0:: 600
w
0
800
1000
0
1000
~ 2000
5
;E 3000
tl.
w
0
~ OOO
5000
-50
-30
0
30
60
90
a
LATlfuDE
0
200
-.=. 400
;::
Il600
L..
0
800
1000
0
1000
~ 2000
~
~ 3000
0w
0 4000
5000
b
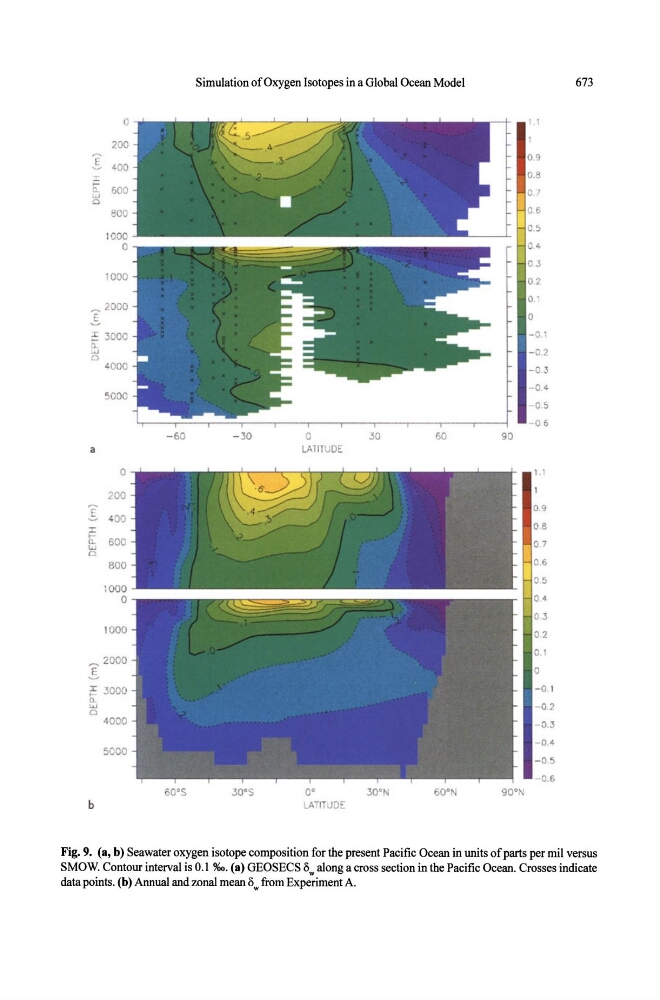
Fig. 9. (a, b) Seawater oxygen isotope composition for the present Pacific Ocean in units of parts per mil versus
SMOW. Contour interval is 0.1 %0. (a) GEOSECS &w along a cross section in the Pacific Ocean. Crosses indicate
data points. (b) Annual and zonal mean &w from Experiment A.