

a
200
~ 600
L
C.
1100
Simulation of Oxygen Isotopes in a Global Ocean Model
COO J---~~----------~--~----~~~------~~~~~--L
0 -r-- . . .r.n~
1000
~ 2000
J:.
;!: 3000
\.
e £000
~OOO
-60
a
60'S
b
- 30
JO'S
o·
ATllUC'[
.10
30'N
6C
90
60·~
gO'/>;
I"
09
0.8
07
os
o.~
0'
OJ
02
0."
o
-0·
-02
-03
-0 •
-05
06
671
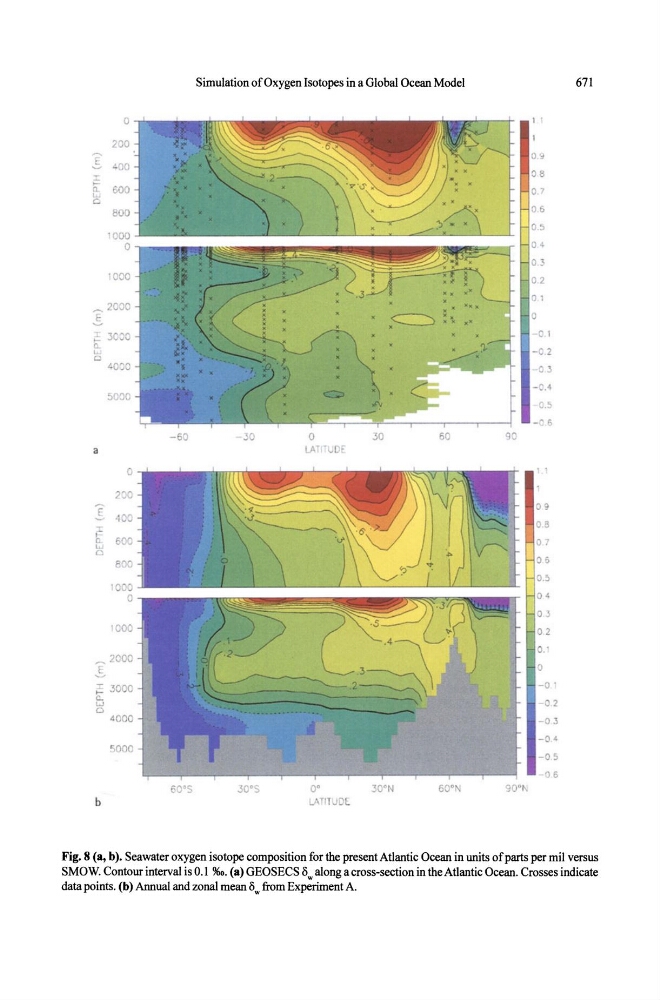
Fig. 8 (a, b). Seawater oxygen isotope composition for the present Atlantic Ocean in units of parts per mil versus
SMOW. Contour interval is 0.1 %0. (a) GEOSECS Ow along a cross-section in the AtIantic Ocean. Crosses indicate
data points. (b) Annual and zonal mean Ow from Experiment A.