

o
200
g 400
r
~ 600
<.:>
800
1000
.-.. 7000
..E~
iE 3000
a.
..... o 4000
5000
a
o
700
I 400
r
ln
600
....,
o
800
1000
~ 2000
E
r= 3000
a.
..... o 4000
:'000
b
Simulation of Oxygen Isotopes in a Global Ocean Model
60'S
JO'S
60'S
30'S
0'
LATlTUO[
SO'N
0'
30'N
LATITUDE
60'N
60'N
669
90'N
90'N
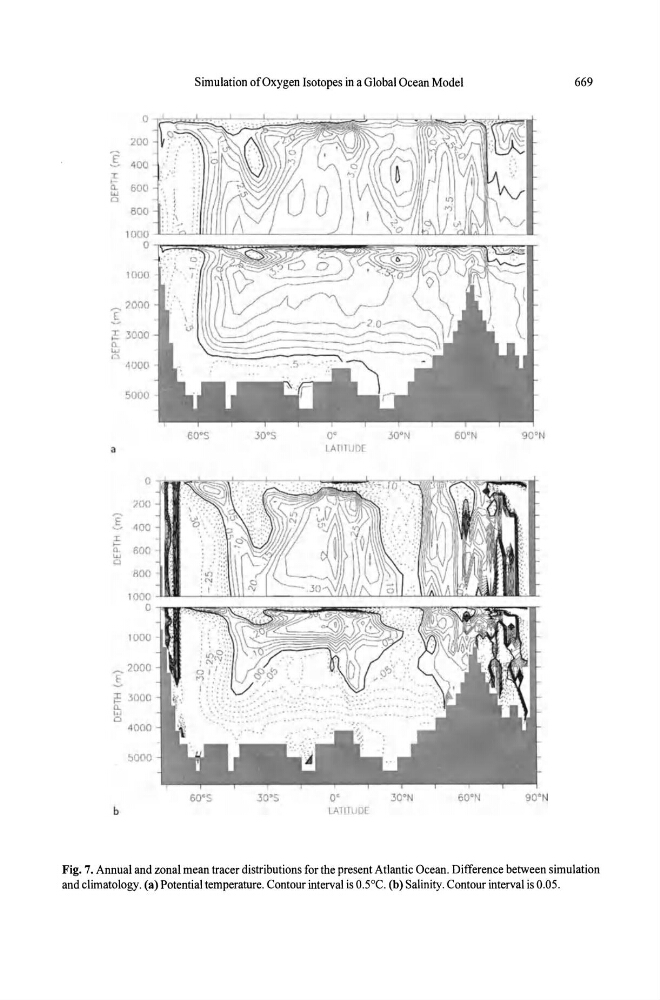
Fig. 7. Annual and zonal mean tracer distributions for the present Atlantic Ocean. Difference between simulation
and climatology. (a) Potential temperature. Contour interval is O.5°C. (b) Salinity. Contour interval is 0.05.