

The Magnetic View on the Marine Paleoenvironment
581
0.5 so
, , , ,
PSO
, , , , ,
'0.2
,
0.8. '\
0.96 • '..
19 ill ,
3.8\~
V)
0.1
:2:
......
, ,
6.4 .(!!
:2:
1~·.~ \ \
18.2 J \\
MO
3°,,57 'r 131 \ \
0.05
0.02
0.01
2
3
5
10
2
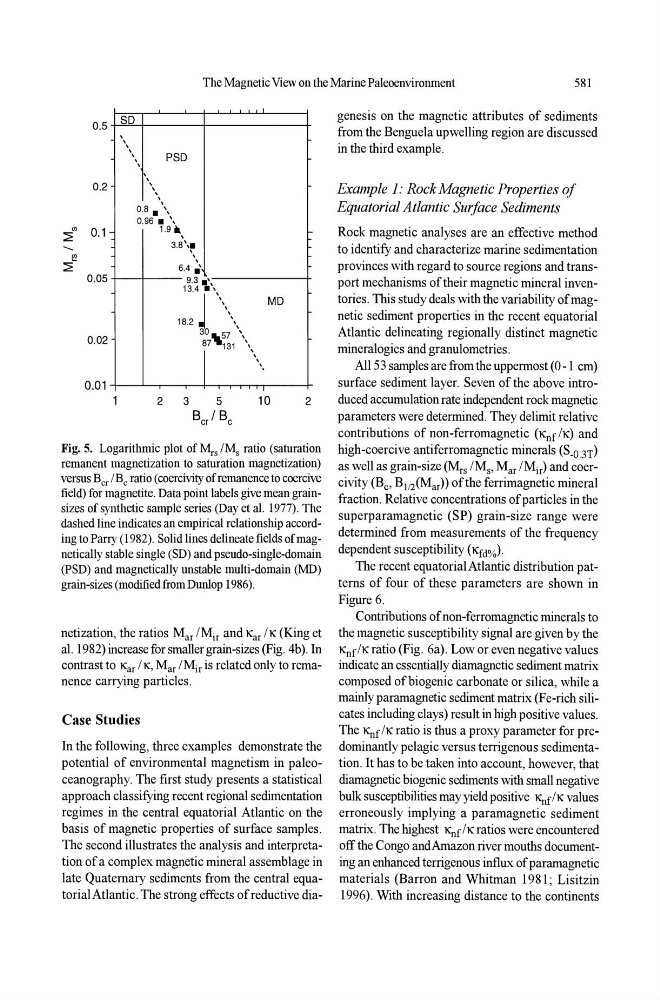
Fig. 5. Logarithmic plot of ~s IMs ratio (saturation
remanent magnetization to saturation magnetization)
versus Ber IBe ratio (coercivity of remanence to coercive
field) for magnetite. Data point labels give mean grain·
sizes of synthetic sample series (Day et al. 1977). The
dashed line indicates an empirical relationship according to Parry (1982). Solid lines delineate fields of magnetically stable single (SD) and pseudo-single-domain
(PSD) and magnetically unstable multi-domain (MD)
grain-sizes (modified from Dunlop 1986).
netization, the ratios Mar IMir and Kar I K (King et
al. 1982) increase for smaller grain-sizes (Fig. 4b). In
contrast to Kar IK, Mar IMir is related only to remanence carrying particles.
Case Studies
In the following, three examples demonstrate the
potential of environmental magnetism in paleoceanography. The first study presents a statistical
approach classifying recent regional sedimentation
regimes in the central equatorial Atlantic on the
basis of magnetic properties of surface samples.
The second illustrates the analysis and interpretation of a complex magnetic mineral assemblage in
late Quaternary sediments from the central equatorialAtlantic. The strong effects of reductive diagenesis on the magnetic attributes of sediments
from the Benguela upwelling region are discussed
in the third example.
Example 1: Rock Magnetic Properties of
Equatorial Atlantic Surface Sediments
Rock magnetic analyses are an effective method
to identify and characterize marine sedimentation
provinces with regard to source regions and transport mechanisms of their magnetic mineral inventories. This study deals with the variability of magnetic sediment properties in the recent equatorial
Atlantic delineating regionally distinct magnetic
mineralogies and granulometries.
All 53 samples are from the uppermost (0-1 cm)
surface sediment layer. Seven of the above introduced accumulation rate independent rock magnetic
parameters werc determined. They delimit relative
contributions of non-ferromagnetic (Knf/K) and
high-coercive antiferromagnetic minerals (S-03T)
as well as grain-size (Mrs IM s , Mar IM ir ) and coercivity (Be' B1/2(Mar)) of the ferrimagnetic mineral
fraction. Relative concentrations of particles in the
superparamagnetic (SP) grain-size range were
determined from measurements of the frequency
dependent susceptibility (Kfd%).
The recent equatorial Atlantic distribution patterns of four of these parameters are shown in
Figure 6.
Contributions of non-ferromagnetic minerals to
the magnetic susceptibility signal are given by the
Knf/K ratio (Fig. 6a). Low or even negative values
indicate an essentially diamagnetic sediment matrix
composed of biogenic carbonate or silica, while a
mainly paramagnetic sediment matrix (Fe-rich silicates including clays) result in high positive values.
The Knf/K ratio is thus a proxy parameter for prcdominantly pelagic versus terrigenous sedimentation. It has to be taken into account, however, that
diamagnetic biogenic sediments with small negative
bulk susceptibilities may yield positive Knr/K values
erroneously implying a paramagnetic sediment
matrix. The highest Knr/K ratios were encountered
off the Congo andAmazon river mouths documenting an enhanced terrigenous influx of paramagnetic
materials (Barron and Whitman 1981; Lisitzin
1996). With increasing distance to the continents