

566
c.CO,('k) •
M 1l &S ~
Wagner and Dupont
• and (%)
Opal (%).
10
20
30
0
~
..
6
0,0 0.1 0.2 IL)
AROpa' ·
TOC(%)
O,OlUO" .. O.6UJ1
11.00
O.O:!
OJ).I
ARTOC
T('rr-l{:('u ou..'I(t;t.) •
o
10
20
.\0
0,1
1.1
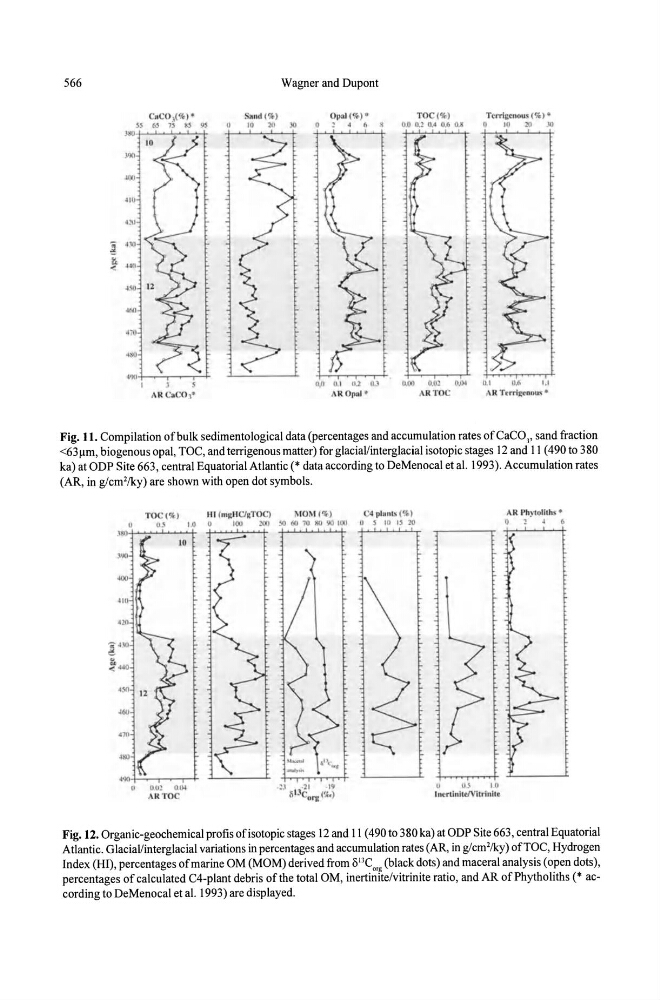
Fig. 11. Compilation of bulk sedimentological data (percentages and accumulation rates of CaCO" sand fraction
<63Iim, biogenous opal, TOC, and terrigenous matter) for glacial/interglacial isotopic stages 12 and 11 (490 to 380
ka) at ODP Site 663, central Equatorial Atlantic (* data according to DeMenocal et al. 1993). Accumulation rates
(AR, in glcm' /ky) are shown with open dot symbols.
TOC (%)
H( (m.HC/gTOC)
MOM (%)
C4 plan", ('k)
o
OJ.
1.0
U
IOU
200 ~ 60 70 ISO 90 1«:0
0 $ 10 IS, 2'0
Jlj() +,"~"""""~"""
~90
o
u_ . . .
10
InertlnlteNltrinile
,\ R Ph:vloIiIM ·
o
6
Fig. 12. Organic-geochemical profis of isotopic stages 12 and 11 (490 to 380 ka) at ODP Site 663, central Equatorial
Atlantic. Glacial/interglacial variations in percentages and accumulation rates (AR, in glcm' /ky) ofTOC, Hydrogen
Index (HI), percentages of marine OM (MOM) derived from 8 1l C.,g (black dots) and maceral analysis (open dots),
percentages of calculated C4-plant debris of the total OM, inertinite/vitrinite ratio, and AR of Phytholiths (* according to DeMenocal et al. 1993) are displayed.