

564
Wagner and Dupont
(Fig. 8b) which determines the bulk terrestrial distribution (Fig. 8a). Vitrinite shows an oceanward
gradient covering a total range of) 0-30% (Fig. 8a).
Enhanced deposition of inertinite, in contrast, is
mainly restricted to near-continental settings (Fig.
8c). The total range of inertinite is considerably
smaller than for vitrinite, i.e. < 5-12%. This observation is opposite to the general depositional trend,
whereupon an increasing transport distance causes
a greater degree of chemical degradation and,
consequently, leads to an enhanced transport of
inertinite to open marine deposits (Stein et al. 1989;
Littke 1993). The pattern observed in the Equatorial Atlantic may be related to sorting processes according to average density and grain size during
eolian transport.
To test whether terrigenous OM is mainly windblown in the modem pelagic Equatorial Atlantic we
compared the distribution of macerals with those
of palynomorphs. Ruddiman and Janecek (1989)
and Bonifay and Giresse (1992) localize the main
source area for terrigenous dust reaching the central and eastern Equatorial Atlantic in the lake Chad
area. Under modern climatic conditions this area
is mainly covered by a savannah type of vegetation which is dominated by C4-grass plants (Giresse
et al. 1994). Hence, if eolian dust released to the
Equatorial Atlantic originates from these typical
habitats ofC4-grass vegetation it appears reasonable to expect at least some admixture in the
terrigenous organic fraction which could have an
effect on the bulk sedimentary 8 J3 C mg signal. This
working hypothesis was recenty applied to Plio/
Pleistocene deposits ofODP Site 959 (Ivory Coast!
Ghana) revealing a maximum contribution of 1238% C4-material to the total OM (Wagner 1998).
The distribution of palynomorphs in the modem
tropical eastern Atlantic ocean provides additional
information on the source areas of terrestrial OM
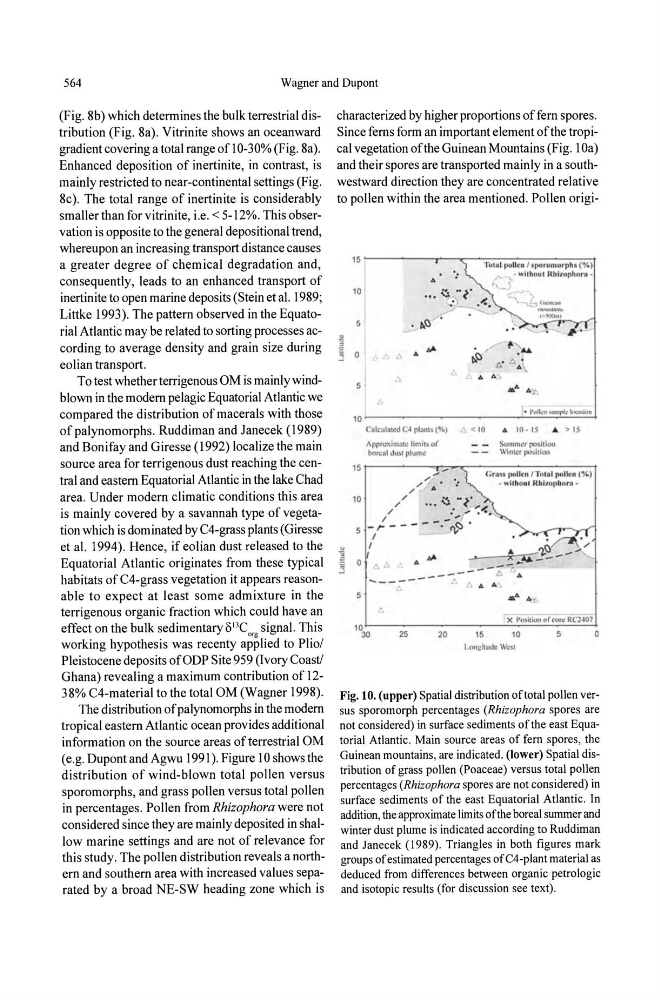
(e.g. Dupont and Agwu 1991). Figure 10 shows the
distribution of wind-blown total pollen versus
sporomorphs, and grass pollen versus total pollen
in percentages. Pollen from Rhizophora were not
considered since they are mainly deposited in shallow marine settings and are not of relevance for
this study. The pollen distribution reveals a northern and southern area with increased values separated by a broad NE-SW heading zone which is
characterized by higher proportions of fern spores.
Since ferns form an important element of the tropical vegetation ofthe Guinean Mountains (Fig. lOa)
and their spores are transported mainly in a southwestward direction they are concentrated relative
to pollen within the area mentioned. Pollen origi15----------,---~~~~~--------~
Tol al pollen J sporonlorpb ('Y.)
10
5
..
;~ ....... - wlihuul llliiwllhurn1\.._- )
10 ______________________ ~ · ~I~=~~
t::. 0:: 10
.6
10· IS
.. ')0 IS
APPNxilltptc linlit,o(
bor.:-al duSI plulnc
SI.mmer r'IOSlli\)ll
Winler .)OSiliou
15r--------/-,,~-~ . ~--(-:~ -'-.-I~-"'-n- ,-Th- "-,~--"'-n-(~-~;
,,;' .6..:
& " ilhoul RhilOpluu·" .
10
/ /
... ~ . - ~ ... ....
/
. I .... . -,
5 - /
- - - - -.-
~
l', tJ>
.6.
_ - -
..... ___ - - - - -... - - - - ~ r' 6
. . . ~, 4 .6. \
Fig. 10. (upper) Spatial distribution of total pollen versus sporomorph percentages (Rhizophora spores are
not considered) in surface sediments ofthe east Equatorial Atlantic. Main source areas of fern spores, the
Guinean mountains, are indicated. (lower) Spatial distribution of grass pollen (Poaceae) versus total pollen
percentages (Rhizophora spores are not considered) in
surface sediments of the east Equatorial Atlantic. In
addition, the approximate limits of the boreal summer and
winter dust plume is indicated according to Ruddiman
and Janecek (1989). Triangles in both figures mark
groups of estimated percentages of C4-plant material as
deduced from differences between organic petrologic
and isotopic results (for discussion see text).