

Terrestrial Organic Matter in Marine Sediments
549
Glacial sediments (0-1 rna)
4.0
500
(c)
(f)
3.5
0
II
I
.- 450 g
'D 3.0
00 0
400 ....
~ 08
350 tJ
..
:c
cg, 2.5
300 E
il
(J
:r:
250 ~
.: l2.0
' "
=
~ iii 1.5
200 ";;
..
";l
01)
+
150 e
·C iii 1.0
~
...
0
100 =0'
0.5
R2 = 0.82; N = 171
~
50
E
0.24 = X·intercept
~
0
0
'" os
Past interglacial sediments (0·1 rna)
"
~
4.0
(b)
R2 = 0.73; N = 182
500
""
(e)
~
3.5
0.12 = X-intercept
450
tI.l
II
I
:: ~
i:..
§ 3.0
'D
r:l 2.5
=
OIl
300 E
~2.0
250 ~
...
!
ZOO .s
rtl 1.5
=
+
150 ~
....
'" 1.0
'C
lOO =0.5
50
0
0
4.0R2 =0.87; N = 20
500
(a)
3.5
0.12 = X-inlercept
I
450
II
~·400 g
:l
3.0
···350 ~
.: 'D
U
" S r:l 2.5
300 ~
:a 5
"
tI.l
~ 2.0
. 250 ~
..
...
" .s
. 200 .s
~ rtl 1.5
V
=
=
..
tI.l
+
0
00 0
150 e
r;; 1.0
~
...
~
100 =0.5
50
K
IV
0
0.2 0.4 0.6 0.8 1.0 1.2 1.4
350
400
450
500
TOC(%)
Tmax(")
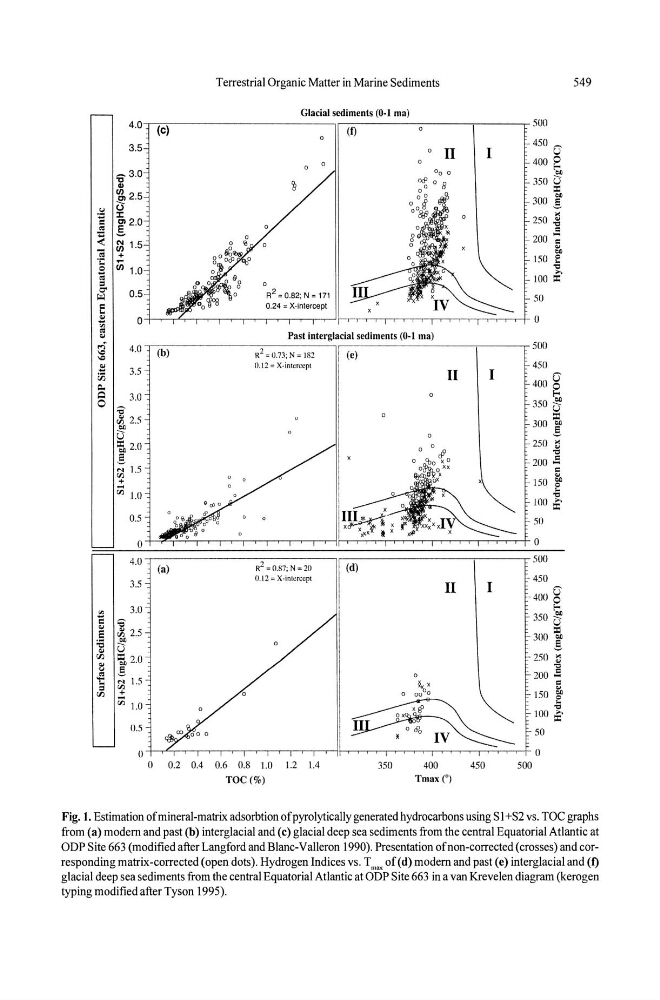
Fig. I. Estimation of mineral-matrix adsorbtion of pyrolytically generated hydrocarbons using S I +S2 vs. TOC graphs
from (a) modem and past (b) interglacial and (c) glacial deep sea sediments from the central Equatorial Atlantic at
ODP Site 663 (modified after Langford and B1anc-Valleron 1990). Presentation of non-corrected (crosses) and corresponding matrix-corrected (open dots). Hydrogen Indices vs. T m~ of (d) modem and past (e) interglacial and (I)
glacial deep sea sediments from the centralEquatorial Atlantic at ODP Site 663 in a van Krevelen diagram (kerogen
typing modified after Tyson 1995).
549
Glacial sediments (0-1 rna)
4.0
500
(c)
(f)
3.5
0
II
I
.- 450 g
'D 3.0
00 0
400 ....
~ 08
350 tJ
..
:c
cg, 2.5
300 E
il
(J
:r:
250 ~
.: l2.0
' "
=
~ iii 1.5
200 ";;
..
";l
01)
+
150 e
·C iii 1.0
~
...
0
100 =0'
0.5
R2 = 0.82; N = 171
~
50
E
0.24 = X·intercept
~
0
0
'" os
Past interglacial sediments (0·1 rna)
"
~
4.0
(b)
R2 = 0.73; N = 182
500
""
(e)
~
3.5
0.12 = X-intercept
450
tI.l
II
I
:: ~
i:..
§ 3.0
'D
r:l 2.5
=
OIl
300 E
~2.0
250 ~
...
!
ZOO .s
rtl 1.5
=
+
150 ~
....
'" 1.0
'C
lOO =0.5
50
0
0
4.0R2 =0.87; N = 20
500
(a)
3.5
0.12 = X-inlercept
I
450
II
~·400 g
:l
3.0
···350 ~
.: 'D
U
" S r:l 2.5
300 ~
:a 5
"
tI.l
~ 2.0
. 250 ~
..
...
" .s
. 200 .s
~ rtl 1.5
V
=
=
..
tI.l
+
0
00 0
150 e
r;; 1.0
~
...
~
100 =0.5
50
K
IV
0
0.2 0.4 0.6 0.8 1.0 1.2 1.4
350
400
450
500
TOC(%)
Tmax(")
Fig. I. Estimation of mineral-matrix adsorbtion of pyrolytically generated hydrocarbons using S I +S2 vs. TOC graphs
from (a) modem and past (b) interglacial and (c) glacial deep sea sediments from the central Equatorial Atlantic at
ODP Site 663 (modified after Langford and B1anc-Valleron 1990). Presentation of non-corrected (crosses) and corresponding matrix-corrected (open dots). Hydrogen Indices vs. T m~ of (d) modem and past (e) interglacial and (I)
glacial deep sea sediments from the centralEquatorial Atlantic at ODP Site 663 in a van Krevelen diagram (kerogen
typing modified after Tyson 1995).