

Reconstruction of Surface Ocean Nitrate Utilization
459
a)
9
c)
10
£
em
'(ij
0
>
>
0
l
0
8
00
~7
z
z
I.!l
I.!l
00
<0
0
~6
~
0
I1l
11
.s
~ Zai", estuary
C 6
§
c
(J)
Q)
E
o Zaire Fan
.~ 5
o Zaire Fan
=c
o Middle Angola
11
"0
o Middle Angola
(J)
Q)
(/)
" Southern Angola
11
C/)
" Southern Angola
4
4
I
I
0
200
400
600
-1 -0.5 0 0.5
1.5 2
Distance from coast (km)
In [N0 3 -]
b) 12
d)
12
+
'C'
£'
' ro
I1l
~10
~
l
z
Z
Ln
Ln
r:o 8
~ 8
• •
~
+ Northern Namibia
~
.s
I1l
• Walvis Bay
C
+ Northern Namibia
t
c
(J)
Q) 6
• U.ideritz
E 6 • Walvis Bay
E
•
'8
• Orange River
=c
• LOderitz
(J)
Q)
(/)
(f)
• Orange River
4
4
I
I
I
0
500
1000 1500
-2 -1.5 -1 -0.5 0 0.5
1.5 2
Distance from coast (km)
In [N0 3 -]
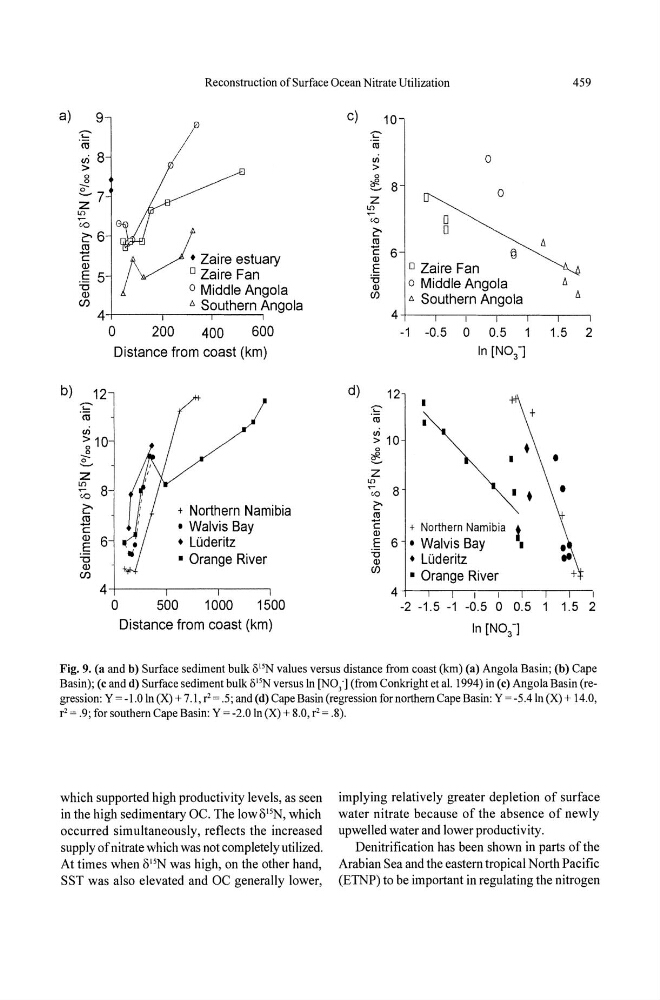
Fig. 9. (a and b) Surface sediment bulk /i"N values versus distance from coast (krn) (a) Angola Basin; (b) Cape
Basin); (c and d) Surface sediment bulk Ii"N versus In [NO,'] (from Conkright et aI. 1994) in (c) Angola Basin (regression: Y = -1.0 In (X) + 7.1, r2 = .5; and (d) Cape Basin (regression fornorthem Cape Basin: Y = -5AIn (X) + 14.0,
r2 = .9; for southern Cape Basin: Y = -2.0 In (X) + 8.0, r2 = .8).
which supported high productivity levels, as seen
in the high sedimentary OC. The low olIN, which
occurred simultaneously, reflects the increased
supply of nitrate which was not completely utilized.
At times when olIN was high, on the other hand,
SST was also elevated and OC generally lower,
implying relatively greater depletion of surface
water nitrate because of the absence of newly
upwelled water and lower productivity.
Denitrification has been shown in parts of the
Arabian Sea and the eastern tropical North Pacific
(ETNP) to be important in regulating the nitrogen
459
a)
9
c)
10
£
em
'(ij
0
>
>
0
l
0
8
00
~7
z
z
I.!l
I.!l
00
<0
0
~6
~
0
I1l
11
.s
~ Zai", estuary
C 6
§
c
(J)
Q)
E
o Zaire Fan
.~ 5
o Zaire Fan
=c
o Middle Angola
11
"0
o Middle Angola
(J)
Q)
(/)
" Southern Angola
11
C/)
" Southern Angola
4
4
I
I
0
200
400
600
-1 -0.5 0 0.5
1.5 2
Distance from coast (km)
In [N0 3 -]
b) 12
d)
12
+
'C'
£'
' ro
I1l
~10
~
l
z
Z
Ln
Ln
r:o 8
~ 8
• •
~
+ Northern Namibia
~
.s
I1l
• Walvis Bay
C
+ Northern Namibia
t
c
(J)
Q) 6
• U.ideritz
E 6 • Walvis Bay
E
•
'8
• Orange River
=c
• LOderitz
(J)
Q)
(/)
(f)
• Orange River
4
4
I
I
I
0
500
1000 1500
-2 -1.5 -1 -0.5 0 0.5
1.5 2
Distance from coast (km)
In [N0 3 -]
Fig. 9. (a and b) Surface sediment bulk /i"N values versus distance from coast (krn) (a) Angola Basin; (b) Cape
Basin); (c and d) Surface sediment bulk Ii"N versus In [NO,'] (from Conkright et aI. 1994) in (c) Angola Basin (regression: Y = -1.0 In (X) + 7.1, r2 = .5; and (d) Cape Basin (regression fornorthem Cape Basin: Y = -5AIn (X) + 14.0,
r2 = .9; for southern Cape Basin: Y = -2.0 In (X) + 8.0, r2 = .8).
which supported high productivity levels, as seen
in the high sedimentary OC. The low olIN, which
occurred simultaneously, reflects the increased
supply of nitrate which was not completely utilized.
At times when olIN was high, on the other hand,
SST was also elevated and OC generally lower,
implying relatively greater depletion of surface
water nitrate because of the absence of newly
upwelled water and lower productivity.
Denitrification has been shown in parts of the
Arabian Sea and the eastern tropical North Pacific
(ETNP) to be important in regulating the nitrogen