

Sediment Redistribution, 230Th" - Normalization and Implications for the Reconstruction of Particle Flux 423
a) Holocene
c) GlacialJHolocene
o·
o
~
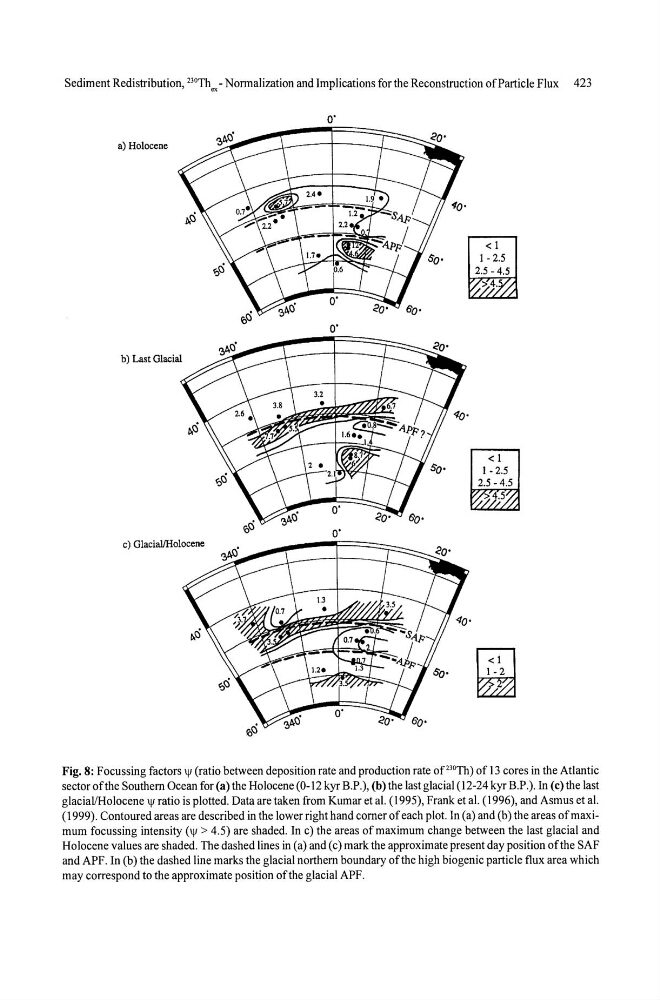
Fig. 8: Focussing factors \II (ratio between deposition rate and production rate of 210 Th) of 13 cores in the Atlantic
sector of the Southern Ocean for (a) the Holocene (0-12 kyr B.P.), (b) the last glacial (12-24 kyr B.P.). In (c) the last
glacial/Holocene \II ratio is plotted. Data are taken from Kumar et al. (1995), Frank et al. (1996), and Asmus et al.
(1999). Contoured areas are described in the lower right hand corner of each plot. In (a) and (b) the areas of max imum focussing intensity (\II > 4.5) are shaded. In c) the areas of maximum change between the last glacial and
Holocene values are shaded. The dashed lines in (a) and (c) mark the approximate present day position of the SAF
and APF. In (b) the dashed line marks the glacial northern boundary ofthe high biogenic particle flux area which
may correspond to the approximate position of the glacial APF.
a) Holocene
c) GlacialJHolocene
o·
o
~
Fig. 8: Focussing factors \II (ratio between deposition rate and production rate of 210 Th) of 13 cores in the Atlantic
sector of the Southern Ocean for (a) the Holocene (0-12 kyr B.P.), (b) the last glacial (12-24 kyr B.P.). In (c) the last
glacial/Holocene \II ratio is plotted. Data are taken from Kumar et al. (1995), Frank et al. (1996), and Asmus et al.
(1999). Contoured areas are described in the lower right hand corner of each plot. In (a) and (b) the areas of max imum focussing intensity (\II > 4.5) are shaded. In c) the areas of maximum change between the last glacial and
Holocene values are shaded. The dashed lines in (a) and (c) mark the approximate present day position of the SAF
and APF. In (b) the dashed line marks the glacial northern boundary ofthe high biogenic particle flux area which
may correspond to the approximate position of the glacial APF.