

Sediment Redistribution, 230Th" - Normalization and Implications for the Reconstruction of Particle Flux 421
Sed. Ace. Ralc +
·cd. Acc . Rale +
a)
b)
c)
d)
e)
Rain Rale
Rain Rate
Rain Rate
Rain Ratc
Isotope
[glcm' . kyrJ
231 Pa / 23o,'h
..
~x
[glcm 1 . k rJ
[glem" kyrJ
[glcm 2 . kyr] Stages
0 5 10 152025 0.0
0.1
0.2 0 1 2 3 4 0 2 4 6 8 0 I 2 3 4
0
20
40
60~r---------~----~~--~--~~----~
80
100
120
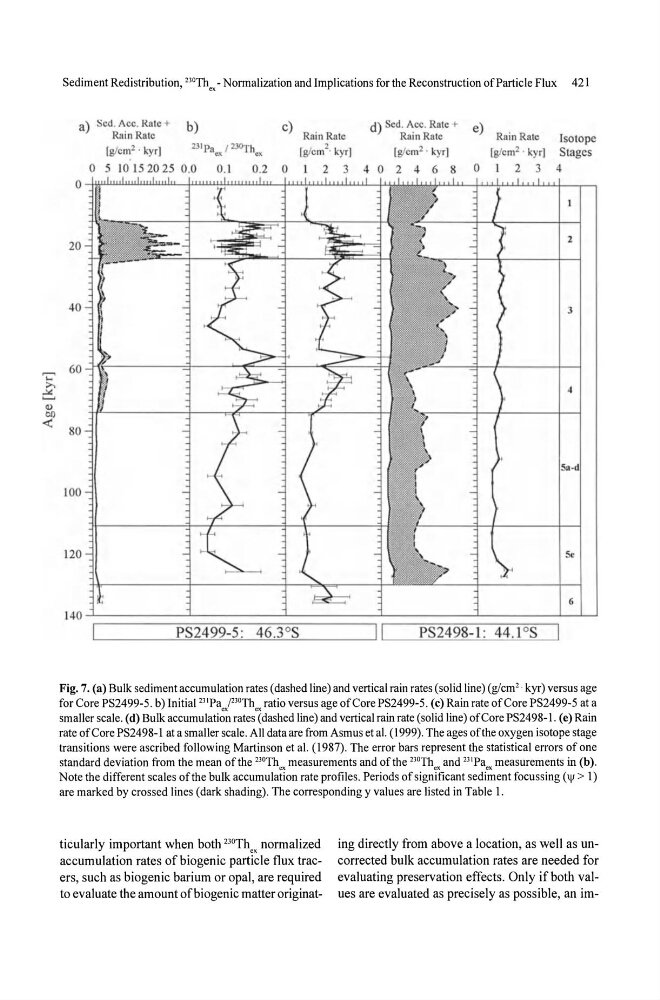
Fig. 7. (a) Bulk sediment accumulation rates ( dashed line) and vertical rain rates (solid line) (g/cm2 kyr) versus age
for Core PS2499-S. b) Initial 231Pa 1 23 °Th ratio versus age of Core PS2499-S. (c) Rain rate of Core PS2499-S at a
smaller scale. (d) Bulk accumulati~~ rates'Cdashed line) and vertical rain rate (solid line) of Core PS2498-1. (e) Rain
rate of Core PS2498-J at a smaller scale. All data are from Asmus et al. (1999). The ages of the oxygen isotope stage
transitions were ascribed following Martinson et al. (1987). The error bars represent the statistical errors of one
standard deviation from the mean of the 23°Th measurements and of the 23°Th and 231Pa measurements in (b).
Note the different scales of the bulk accumulation rate profiles. Periods of significant sedi~ent focussing (\II > I)
are marked by crossed lines (dark shading). The corresponding y values are listed in Table I.
ticularly important when both 230Th,x normalized
accumulation rates of biogenic particle flux tracers, such as biogenic barium or opal, are required
to evaluate the amount of biogenic matter originating directly from above a location, as well as uncorrected bulk accumulation rates are needed for
evaluating preservation effects. Only if both values are evaluated as precisely as possible, an im-
Sed. Ace. Ralc +
·cd. Acc . Rale +
a)
b)
c)
d)
e)
Rain Rale
Rain Rate
Rain Rate
Rain Ratc
Isotope
[glcm' . kyrJ
231 Pa / 23o,'h
..
~x
[glcm 1 . k rJ
[glem" kyrJ
[glcm 2 . kyr] Stages
0 5 10 152025 0.0
0.1
0.2 0 1 2 3 4 0 2 4 6 8 0 I 2 3 4
0
20
40
60~r---------~----~~--~--~~----~
80
100
120
Fig. 7. (a) Bulk sediment accumulation rates ( dashed line) and vertical rain rates (solid line) (g/cm2 kyr) versus age
for Core PS2499-S. b) Initial 231Pa 1 23 °Th ratio versus age of Core PS2499-S. (c) Rain rate of Core PS2499-S at a
smaller scale. (d) Bulk accumulati~~ rates'Cdashed line) and vertical rain rate (solid line) of Core PS2498-1. (e) Rain
rate of Core PS2498-J at a smaller scale. All data are from Asmus et al. (1999). The ages of the oxygen isotope stage
transitions were ascribed following Martinson et al. (1987). The error bars represent the statistical errors of one
standard deviation from the mean of the 23°Th measurements and of the 23°Th and 231Pa measurements in (b).
Note the different scales of the bulk accumulation rate profiles. Periods of significant sedi~ent focussing (\II > I)
are marked by crossed lines (dark shading). The corresponding y values are listed in Table I.
ticularly important when both 230Th,x normalized
accumulation rates of biogenic particle flux tracers, such as biogenic barium or opal, are required
to evaluate the amount of biogenic matter originating directly from above a location, as well as uncorrected bulk accumulation rates are needed for
evaluating preservation effects. Only if both values are evaluated as precisely as possible, an im-