

414
Frank eta!'
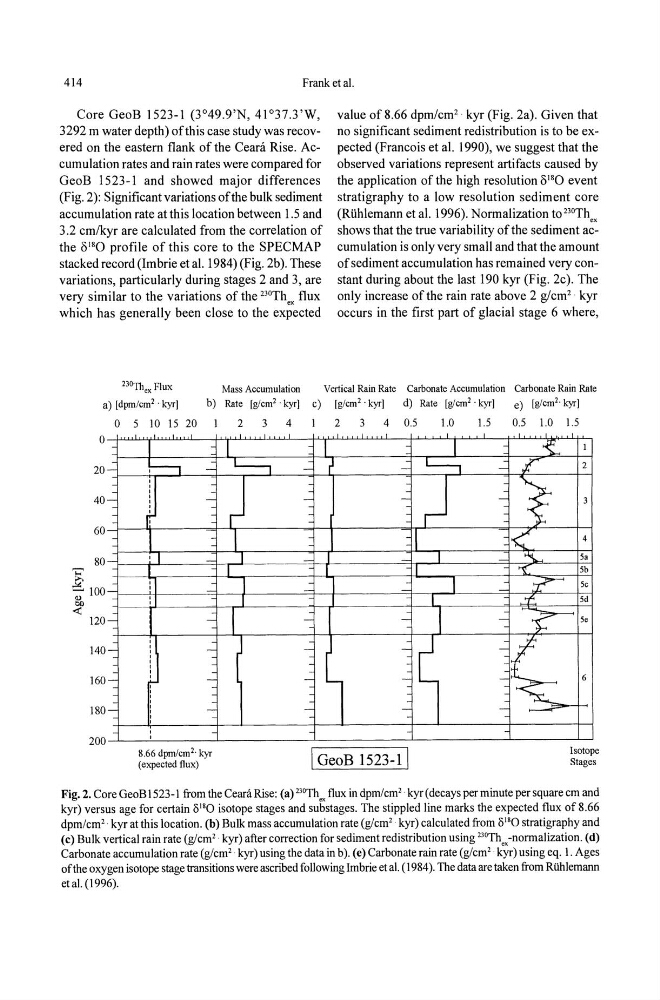
Core GeoB 1523-1 (3°49.9'N, 41°37.3'W,
3292 m water depth) ofthis case study was recovered on the eastern flank of the Ceara Rise. Accumulation rates and rain rates were compared for
GeoB 1523-1 and showed major differences
(Fig. 2): Significant variations ofthe bulk sediment
accumulation rate at this location between 1.5 and
3.2 cm/kyr are calculated from the correlation of
the 8 18 0 profile of this core to the SPECMAP
stacked record (Imbrie et al. 1984) (Fig. 2b). These
variations, particularly during stages 2 and 3, are
very similar to the variations of the 23DThex flux
which has generally been close to the expected
'3D'ill ex Flux
Mass Accumulation
a) [dpm/cm' 'kyr]
b) Rate [g/cm" kyr] c)
o 5 10 15 20
2 3 4
I
value of 8.66 dpm/cm' . kyr (Fig. 2a). Given that
no significant sediment redistribution is to be expected (Francois et al. 1990), we suggest that the
observed variations represent artifacts caused by
the application of the high resolution 8 18 0 event
stratigraphy to a low resolution sediment core
(Riihlemann et al. 1996). Normalization to 2 3D Th ex
shows that the true variability ofthe sediment accumulation is only very small and that the amount
of sediment accumulation has remained very constant during about the last 190 kyr (Fig. 2c). The
only increase of the rain rate above 2 g/cm' . kyr
occurs in the first part of glacial stage 6 where,
Vertical Rain Rate
[glcm' 'kyr]
2
4
Carbonate Accumulation Carbonate Rain Rate
d) Rate [glcm" kyr]
e) [glcm" kyr]
0,5
1.0
1.5
0.5 1.0 1.5
I
1
I
>{
1
o
20 -
40 -
60
-
120 -
140 -
160 -
180 -
200
!----, -
, ,
,
i
-
,
,
T
'I
-
I
,
,
, ,
1
-
, , ,
-
, ,
, , ,
-
, , , ,
, ,
-
, ,
,
,
8,66 dpm/cm" kyr
(expected flux)
-c:=::;- - r
-
-
-
1 1
- I
-
"1
I
1
I
-
"1
r
-
-
I
-
-
-
-
-
-
1 GeoB 1523-11
L-,
-
~
-
II I
-
11
l
I
-
[
-
-
-
t'
2
{:
3
1<'
4
. ...,.,
Sa
~
5b
:;t-' 50
,~
Sd
r se
1'-,
Isotope
Stages
Fig. 2. Core GeoB1523-1 from the Ceani Rise: (a) '30Th", flux in dpmlcm'· kyr(decays per minute per square cm and
kyr) versus age for certain 1) 18 0 isotope stages and substages. The stippled line marks the expected flux of 8.66
dpm/cm'· kyr at this location. (b) Bulk mass accumulation rate (g/cm' kyr) calculated from 1) 18 0 stratigraphy and
(c) Bulk vertical rain rate (g1cm'· kyr) after correction for sediment redistribution using 23oThex-normalization, (d)
Carbonate accumulation rate (g/cm' kyr) using the data in b). (e) Carbonate rain rate (g/cm" kyr) using eq. 1. Ages
of the oxygen isotope stage transitions were ascribed following Imbrie et a!. (1984), The data are taken from Riihlemann
et a!. (1996).
Frank eta!'
Core GeoB 1523-1 (3°49.9'N, 41°37.3'W,
3292 m water depth) ofthis case study was recovered on the eastern flank of the Ceara Rise. Accumulation rates and rain rates were compared for
GeoB 1523-1 and showed major differences
(Fig. 2): Significant variations ofthe bulk sediment
accumulation rate at this location between 1.5 and
3.2 cm/kyr are calculated from the correlation of
the 8 18 0 profile of this core to the SPECMAP
stacked record (Imbrie et al. 1984) (Fig. 2b). These
variations, particularly during stages 2 and 3, are
very similar to the variations of the 23DThex flux
which has generally been close to the expected
'3D'ill ex Flux
Mass Accumulation
a) [dpm/cm' 'kyr]
b) Rate [g/cm" kyr] c)
o 5 10 15 20
2 3 4
I
value of 8.66 dpm/cm' . kyr (Fig. 2a). Given that
no significant sediment redistribution is to be expected (Francois et al. 1990), we suggest that the
observed variations represent artifacts caused by
the application of the high resolution 8 18 0 event
stratigraphy to a low resolution sediment core
(Riihlemann et al. 1996). Normalization to 2 3D Th ex
shows that the true variability ofthe sediment accumulation is only very small and that the amount
of sediment accumulation has remained very constant during about the last 190 kyr (Fig. 2c). The
only increase of the rain rate above 2 g/cm' . kyr
occurs in the first part of glacial stage 6 where,
Vertical Rain Rate
[glcm' 'kyr]
2
4
Carbonate Accumulation Carbonate Rain Rate
d) Rate [glcm" kyr]
e) [glcm" kyr]
0,5
1.0
1.5
0.5 1.0 1.5
I
1
I
>{
1
o
20 -
40 -
60
-
120 -
140 -
160 -
180 -
200
!----, -
, ,
,
i
-
,
,
T
'I
-
I
,
,
, ,
1
-
, , ,
-
, ,
, , ,
-
, , , ,
, ,
-
, ,
,
,
8,66 dpm/cm" kyr
(expected flux)
-c:=::;- - r
-
-
-
1 1
- I
-
"1
I
1
I
-
"1
r
-
-
I
-
-
-
-
-
-
1 GeoB 1523-11
L-,
-
~
-
II I
-
11
l
I
-
[
-
-
-
t'
2
{:
3
1<'
4
. ...,.,
Sa
~
5b
:;t-' 50
,~
Sd
r se
1'-,
Isotope
Stages
Fig. 2. Core GeoB1523-1 from the Ceani Rise: (a) '30Th", flux in dpmlcm'· kyr(decays per minute per square cm and
kyr) versus age for certain 1) 18 0 isotope stages and substages. The stippled line marks the expected flux of 8.66
dpm/cm'· kyr at this location. (b) Bulk mass accumulation rate (g/cm' kyr) calculated from 1) 18 0 stratigraphy and
(c) Bulk vertical rain rate (g1cm'· kyr) after correction for sediment redistribution using 23oThex-normalization, (d)
Carbonate accumulation rate (g/cm' kyr) using the data in b). (e) Carbonate rain rate (g/cm" kyr) using eq. 1. Ages
of the oxygen isotope stage transitions were ascribed following Imbrie et a!. (1984), The data are taken from Riihlemann
et a!. (1996).