

Reliability of the 231Pa j230Th Activity Ratio
395
For 231Pa the equations are equivalent. The
model parameters are shown in Table I and in Fig.
2a-c. As both 23\Pa and 23tYfh are produced from
their conservative progenitors 235U and 234U, their
respective production rates are uniform throughout
the ocean (Fig. 2a). In both boxes a strong preference for the adsorption of 230Th over 231Pa with
kTh = lOkPa is assumed (Anderson et a1. 1983a).
The particle flux is chosen to be five times higher
at the ocean margin than in its interior (Berger et
a1. 1989) (Fig. 2b), and it is assumed that the scavenging rate coefficients k in both boxes are proportional to the particle flux, so that k m = 5k i . As,s = 11
k, the scavenging residence times for 231Pa ('sPa)
and 230Th ('sTh) are five times higher in box i than
in m (Fig. 2c), in agreement with literature data
(Anderson et a1. 1983a; Bacon 1988; Huh and
Beasley 1987; NozakiandYamada 1987). A value
of300 years is taken for Vlv ex , between the values
of71O and 95 years, which were used by Bacon
(1988) and Anderson et a1. (1990), respectively.
The dissolved concentrations of23\Pa and 230Th
(Fig. 2d) can now be calculated by solving equamodel ocean A: closed ocean basin
interior
(i)
Ci
t O·8kiCiV
O.SV
VexCi
vexcm
margin
(m)
O.2V
c m
o.2k
1
Cmv
tions (1) and (2). As 'si Th (30 years) is small compared to Vlvex (300 years), only a minor fraction of
the 230Th produced in the ocean's interior can be
transported laterally to the margin before being
scavenged. Consequently, the flux of 23 °Th (F Th) approximately equals its rate of production (P Th)' and
even in the high particle flux regions at the margin
F Th only slightly exceeds P Th (Fig. 2e). In contrast,
,h (300 years) is equal to Vlv ,so that a smaller
f;~ction of the 231Pa produced r; the ocean's interior is scavenged from the water column. The remainder is transported laterally to the ocean marproduction rates P (dpm·m·3·a,l)
pIh
0.0252"
pPa
0.00233'
scavenging residence times Is (a)
ocean interior
,Si Th
30
tSi Pa
300
ocean margin
,smTh
6
,smPa
60
horizontal mixing rate vex (a,l)
vexN
0.00333
flushing rate vf(a,l)
vfIV
0.004
• calculated from the activities of' 34 U and "'u in seawater
Table 1. Model parameters.
model ocean B: ventilated ocean basin
interior
margin
(i)
I v,co
(m)
, O.SV O.2V
VexCi
Ci
VexCm
Cm
+ O.8kiCiV I
O.2kTCm~
P,ci
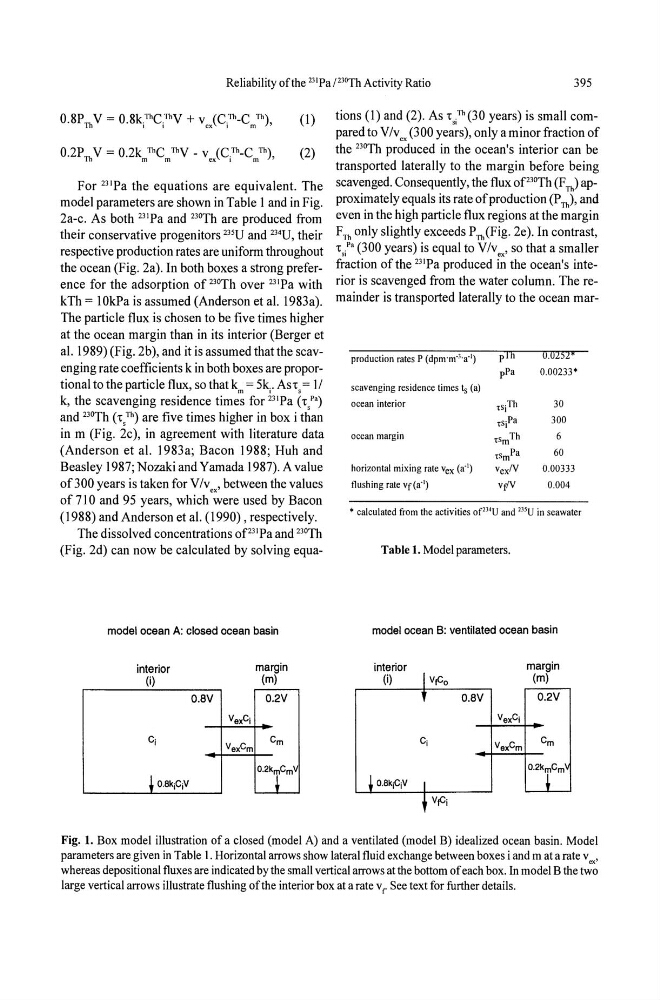
Fig. 1. Box model illustration of a closed (model A) and a ventilated (model B) idealized ocean basin. Model
parameters are given in Table 1. Horizontal arrows show lateral fluid exchange between boxes i and m at a rate v ,
whereas depositional fluxes are indicated by the small vertical arrows at the bottom of each box. In model B the tw~
large vertical arrows illustrate flushing of the interior box at a rate v r See text for further details.
395
For 231Pa the equations are equivalent. The
model parameters are shown in Table I and in Fig.
2a-c. As both 23\Pa and 23tYfh are produced from
their conservative progenitors 235U and 234U, their
respective production rates are uniform throughout
the ocean (Fig. 2a). In both boxes a strong preference for the adsorption of 230Th over 231Pa with
kTh = lOkPa is assumed (Anderson et a1. 1983a).
The particle flux is chosen to be five times higher
at the ocean margin than in its interior (Berger et
a1. 1989) (Fig. 2b), and it is assumed that the scavenging rate coefficients k in both boxes are proportional to the particle flux, so that k m = 5k i . As,s = 11
k, the scavenging residence times for 231Pa ('sPa)
and 230Th ('sTh) are five times higher in box i than
in m (Fig. 2c), in agreement with literature data
(Anderson et a1. 1983a; Bacon 1988; Huh and
Beasley 1987; NozakiandYamada 1987). A value
of300 years is taken for Vlv ex , between the values
of71O and 95 years, which were used by Bacon
(1988) and Anderson et a1. (1990), respectively.
The dissolved concentrations of23\Pa and 230Th
(Fig. 2d) can now be calculated by solving equamodel ocean A: closed ocean basin
interior
(i)
Ci
t O·8kiCiV
O.SV
VexCi
vexcm
margin
(m)
O.2V
c m
o.2k
1
Cmv
tions (1) and (2). As 'si Th (30 years) is small compared to Vlvex (300 years), only a minor fraction of
the 230Th produced in the ocean's interior can be
transported laterally to the margin before being
scavenged. Consequently, the flux of 23 °Th (F Th) approximately equals its rate of production (P Th)' and
even in the high particle flux regions at the margin
F Th only slightly exceeds P Th (Fig. 2e). In contrast,
,h (300 years) is equal to Vlv ,so that a smaller
f;~ction of the 231Pa produced r; the ocean's interior is scavenged from the water column. The remainder is transported laterally to the ocean marproduction rates P (dpm·m·3·a,l)
pIh
0.0252"
pPa
0.00233'
scavenging residence times Is (a)
ocean interior
,Si Th
30
tSi Pa
300
ocean margin
,smTh
6
,smPa
60
horizontal mixing rate vex (a,l)
vexN
0.00333
flushing rate vf(a,l)
vfIV
0.004
• calculated from the activities of' 34 U and "'u in seawater
Table 1. Model parameters.
model ocean B: ventilated ocean basin
interior
margin
(i)
I v,co
(m)
, O.SV O.2V
VexCi
Ci
VexCm
Cm
+ O.8kiCiV I
O.2kTCm~
P,ci
Fig. 1. Box model illustration of a closed (model A) and a ventilated (model B) idealized ocean basin. Model
parameters are given in Table 1. Horizontal arrows show lateral fluid exchange between boxes i and m at a rate v ,
whereas depositional fluxes are indicated by the small vertical arrows at the bottom of each box. In model B the tw~
large vertical arrows illustrate flushing of the interior box at a rate v r See text for further details.