

372
Romeroetal.
Eastern Tropical Atlantic
360
50
.~'.
50
S" 180
"'C
~ 25
-6
\ /~>\ 7/\
\x--------x-------i l \\ \\ . . -/
\.
Cape Blanc
CB1
~
'"
25 E
'" E
Ol
'" E
Ol
x'
'" o
C/)
(])
.s
><
::::l
o
~--_r----_,------,_--~,_----_r-----,------r_----_r0
~
.s 0
><
<+=
Cii 360
o
Ir 180
::::l
<+=
ro 50
c..
0
I
I 25
~
I
I
150
250
350
450
Z.
50 ~
<+=
E
~
Cape Verde
CV1-2
25 i:5
o
0~--,_--_,----_r~~._~--,_--_,----_.----_r0
I
150
250
350
450
S
Su
F
w
Julian days
Boreal I
Season L-________ -L __________ L-______ ~ ________ ~
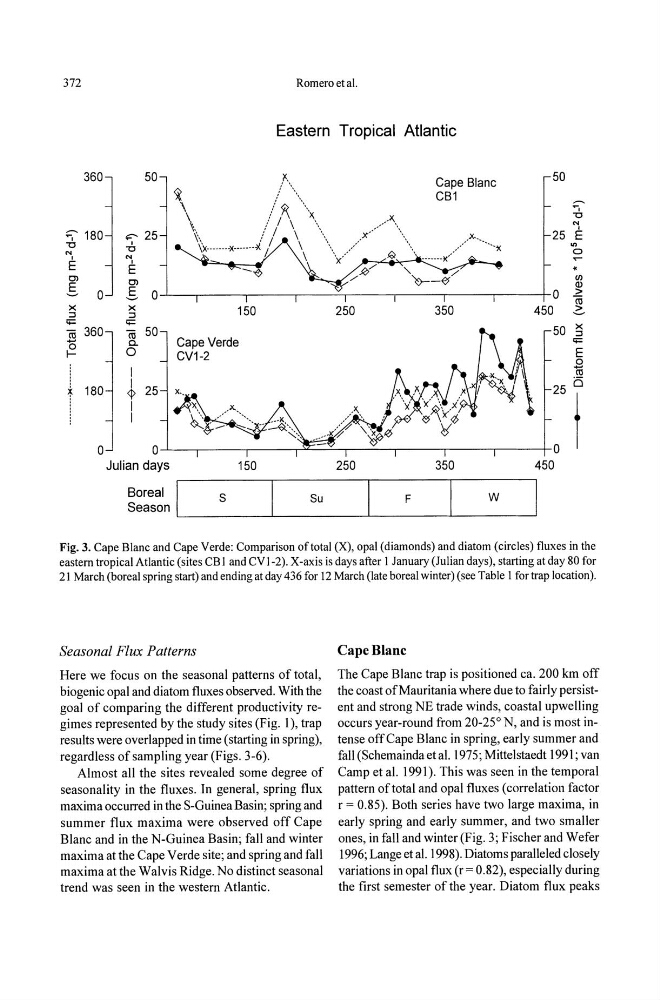
Fig. 3. Cape Blanc and Cape Verde: Comparison oftotal (X), opal (diamonds) and diatom (circles) fluxes in the
eastern tropical Atlantic (sites CBl and CVI-2), X-axis is days after 1 January (Julian days), starting at day 80 for
21 March (boreal spring start) and ending at day 436 for 12 March (late boreal winter) (see Table I for trap location),
Seasonal Flux Patterns
Here we focus on the seasonal patterns of total,
biogenic opal and diatom fluxes observed. With the
goal of comparing the different productivity regimes represented by the study sites (Fig, I), trap
results were overlapped in time (starting in spring),
regardless of sampling year (Figs. 3-6).
Almost all the sites revealed some degree of
seasonality in the fluxes, In general, spring flux
maxima occurred in the S-Guinea Basin; spring and
summer flux maxima were observed off Cape
Blanc and in the N-Guinea Basin; fall and winter
maxima at the Cape Verde site; and spring and fall
maxima at the Walvis Ridge. No distinct seasonal
trend was seen in the western Atlantic,
Cape Blanc
The Cape Blanc trap is positioned ca. 200 km off
the coast of Mauritania where due to fairly persistent and strong NE trade winds, coastal upwelling
occurs year-round from 20-25° N, and is most intense off Cape Blanc in spring, early summer and
fall (Schemaindaetal. 1975; Mittelstaedt 1991; van
Camp et al. 1991). This was seen in the temporal
pattern of total and opal fluxes (correlation factor
r = 0.85). Both series have two large maxima, in
early spring and early summer, and two smaller
ones, in fall and winter (Fig, 3; Fischer and Wefer
1996; Lange et al. 1998), Diatoms paralleled closely
variations in opal flux (r = 0,82), especially during
the first semester of the year. Diatom flux peaks
Romeroetal.
Eastern Tropical Atlantic
360
50
.~'.
50
S" 180
"'C
~ 25
-6
\ /~>\ 7/\
\x--------x-------i l \\ \\ . . -/
\.
Cape Blanc
CB1
~
'"
25 E
'" E
Ol
'" E
Ol
x'
'" o
C/)
(])
.s
><
::::l
o
~--_r----_,------,_--~,_----_r-----,------r_----_r0
~
.s 0
><
<+=
Cii 360
o
Ir 180
::::l
<+=
ro 50
c..
0
I
I 25
~
I
I
150
250
350
450
Z.
50 ~
<+=
E
~
Cape Verde
CV1-2
25 i:5
o
0~--,_--_,----_r~~._~--,_--_,----_.----_r0
I
150
250
350
450
S
Su
F
w
Julian days
Boreal I
Season L-________ -L __________ L-______ ~ ________ ~
Fig. 3. Cape Blanc and Cape Verde: Comparison oftotal (X), opal (diamonds) and diatom (circles) fluxes in the
eastern tropical Atlantic (sites CBl and CVI-2), X-axis is days after 1 January (Julian days), starting at day 80 for
21 March (boreal spring start) and ending at day 436 for 12 March (late boreal winter) (see Table I for trap location),
Seasonal Flux Patterns
Here we focus on the seasonal patterns of total,
biogenic opal and diatom fluxes observed. With the
goal of comparing the different productivity regimes represented by the study sites (Fig, I), trap
results were overlapped in time (starting in spring),
regardless of sampling year (Figs. 3-6).
Almost all the sites revealed some degree of
seasonality in the fluxes, In general, spring flux
maxima occurred in the S-Guinea Basin; spring and
summer flux maxima were observed off Cape
Blanc and in the N-Guinea Basin; fall and winter
maxima at the Cape Verde site; and spring and fall
maxima at the Walvis Ridge. No distinct seasonal
trend was seen in the western Atlantic,
Cape Blanc
The Cape Blanc trap is positioned ca. 200 km off
the coast of Mauritania where due to fairly persistent and strong NE trade winds, coastal upwelling
occurs year-round from 20-25° N, and is most intense off Cape Blanc in spring, early summer and
fall (Schemaindaetal. 1975; Mittelstaedt 1991; van
Camp et al. 1991). This was seen in the temporal
pattern of total and opal fluxes (correlation factor
r = 0.85). Both series have two large maxima, in
early spring and early summer, and two smaller
ones, in fall and winter (Fig, 3; Fischer and Wefer
1996; Lange et al. 1998), Diatoms paralleled closely
variations in opal flux (r = 0,82), especially during
the first semester of the year. Diatom flux peaks