

Kaolinite and Chlorite as Tracers of Modern and Late Quaternary Deep Water Circulation
30 I
Reversed SPECMAP
100-kyr- 1 band
frkr!-I band
23-kyr- 1 band
kO
T
_0 18 0 stack vs. variable
k °Phi
k
°Phi
k °Phi
(ka) (ka)
I. Benthic 0 I 80 record
0.98
-0.1±3.1
0.98
+1.8±3.2
0.98
+4.3±2.5
0.65
306 2.0
(pS2495-3)
2. Kaolinite/chlorite ratio
0.97
-1O.7±3.4
0.97
+0.0±3.8
0.95
-0.1±4.6
0.65
306 2.0
(PS2495-3)
3. %-Kaolinite
0.86
+6.3±8.2
0.81
+17.7±1O.2
0.85
+15.7±8.6 0.65
306 2.0
(PS2495-3)
4. %-Chlorite
0.96
+l63.5±4.0
0.86
+1 7 1.2±8.2
0.84
+167.2±9.l 0.65
306 2.0
(pS2495-3)
5. Kaolinite/chlorite ratio
0.96
-6±1l
0.87
+l1±22
0.64
388 2.0
(pS2082-1)
6. '%NADW index'
0.87
+l6±(15)
0.86
+5±(l6)
0.83
+41±(l7) (0.66)
400 3.0
(Raymo et al. 1990)
Bandwidth for calculations of variables 1-4 is 0.015 ka- I , for variables 5-6 bandwith is 0.010 ka-1ltems tabled are: (k) coherency,
(OPhi) phase angle with 95-% confidence interval, 80-% confidence intervals are given in parentheses, (kO) 95-% test statistics for
nonzero coherency, for 80-% values are given in parentheses, (T) maximal age used in the calculation, (t) sample time interval. Positive
phase differences indicate that the variable lags the SPECMAP 0 18 0 variable. The 0 18 0 SPECMAP stack was taken from Imbrie et al.
(1984). The '%NADW index' (variable 6) is a ol3C proxy for NADW in the North Atlantic relative to Pacific deep water (Raymo et al.
1990). Cross spectral analyses for variables 1-4 were carried out with the 'AnalySeries' software (paillard et al. 1996). Data of variables
5 and 6 are from Diekmann et al. (1996) and were calculated with the 'Arand' software (Howell 1989).
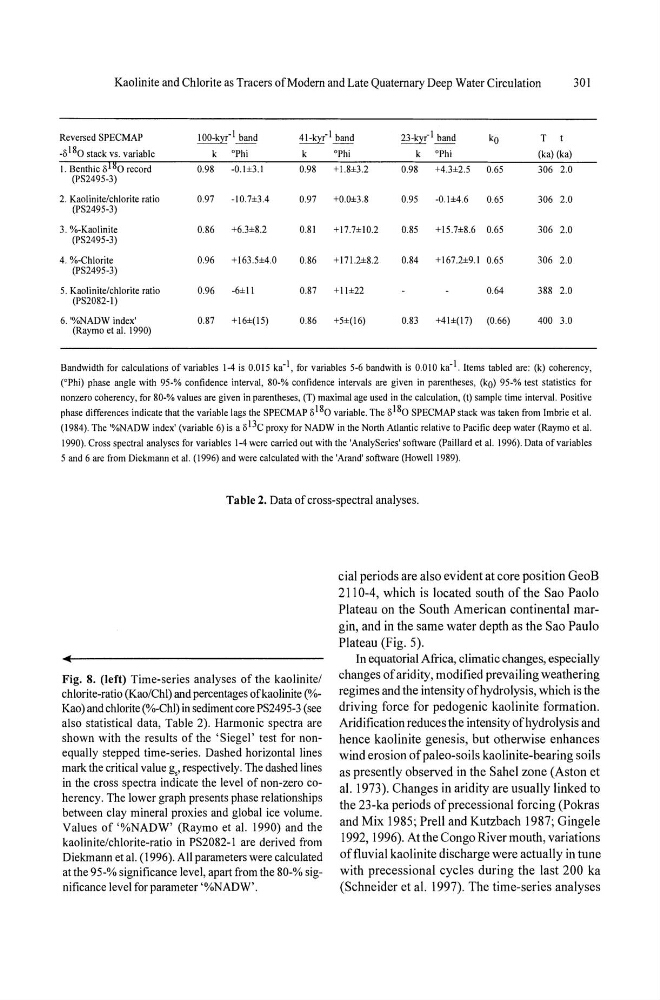
Table 2, Data of cross-spectral analyses.
Fig. 8. (left) Time-series analyses of the kaolinite/
chlorite-ratio (Kao/Chl) and percentages of kaolinite (%Kao) and chlorite (%-Chl) in sedinIent core PS2495-3 (see
also statistical data, Table 2). Harmonic spectra are
shown with the results of the' Siegel' test for nonequally stepped time-series. Dashed horizontal lines
mark the critical value g" respectively. The dashed lines
in the cross spectra indicate the level of non-zero coherency. The lower graph presents phase relationships
between clay mineral proxies and global ice volume.
Values of '%NADW' (Raymo et al. 1990) and the
kaolinite/chlorite-ratio in PS2082-1 are derived from
Diekmann et al. (1996). All parameters were calculated
at the 95-% significance level, apart from the 80-% significance level for parameter '%NADW'.
cial periods are also evident at core position GeoB
211 0-4, which is located south of the Sao Paolo
Plateau on the South American continental margin, and in the same water depth as the Sao Paulo
Plateau (Fig. 5).
In equatorial Africa, climatic changes, especially
changes of aridity, modified prevailing weathering
regimes and the intensity of hydrolysis, which is the
driving force for pedogenic kaolinite formation.
Aridification reduces the intensity of hydrolysis and
hence kaolinite genesis, but otherwise enhances
wind erosion of paleo-soils kaolinite-bearing soils
as presently observed in the Sahel zone (Aston et
al. 1973). Changes in aridity are usually linked to
the 23-ka periods of precessional forcing (Pokras
and Mix 1985; Prell and Kutzbach 1987; Gingele
1992, 1996). At the Congo River mouth, variations
of fluvial kaolinite discharge were actually in tune
with precessional cycles during the last 200 ka
(Schneider et al. 1997). The time-series analyses
30 I
Reversed SPECMAP
100-kyr- 1 band
frkr!-I band
23-kyr- 1 band
kO
T
_0 18 0 stack vs. variable
k °Phi
k
°Phi
k °Phi
(ka) (ka)
I. Benthic 0 I 80 record
0.98
-0.1±3.1
0.98
+1.8±3.2
0.98
+4.3±2.5
0.65
306 2.0
(pS2495-3)
2. Kaolinite/chlorite ratio
0.97
-1O.7±3.4
0.97
+0.0±3.8
0.95
-0.1±4.6
0.65
306 2.0
(PS2495-3)
3. %-Kaolinite
0.86
+6.3±8.2
0.81
+17.7±1O.2
0.85
+15.7±8.6 0.65
306 2.0
(PS2495-3)
4. %-Chlorite
0.96
+l63.5±4.0
0.86
+1 7 1.2±8.2
0.84
+167.2±9.l 0.65
306 2.0
(pS2495-3)
5. Kaolinite/chlorite ratio
0.96
-6±1l
0.87
+l1±22
0.64
388 2.0
(pS2082-1)
6. '%NADW index'
0.87
+l6±(15)
0.86
+5±(l6)
0.83
+41±(l7) (0.66)
400 3.0
(Raymo et al. 1990)
Bandwidth for calculations of variables 1-4 is 0.015 ka- I , for variables 5-6 bandwith is 0.010 ka-1ltems tabled are: (k) coherency,
(OPhi) phase angle with 95-% confidence interval, 80-% confidence intervals are given in parentheses, (kO) 95-% test statistics for
nonzero coherency, for 80-% values are given in parentheses, (T) maximal age used in the calculation, (t) sample time interval. Positive
phase differences indicate that the variable lags the SPECMAP 0 18 0 variable. The 0 18 0 SPECMAP stack was taken from Imbrie et al.
(1984). The '%NADW index' (variable 6) is a ol3C proxy for NADW in the North Atlantic relative to Pacific deep water (Raymo et al.
1990). Cross spectral analyses for variables 1-4 were carried out with the 'AnalySeries' software (paillard et al. 1996). Data of variables
5 and 6 are from Diekmann et al. (1996) and were calculated with the 'Arand' software (Howell 1989).
Table 2, Data of cross-spectral analyses.
Fig. 8. (left) Time-series analyses of the kaolinite/
chlorite-ratio (Kao/Chl) and percentages of kaolinite (%Kao) and chlorite (%-Chl) in sedinIent core PS2495-3 (see
also statistical data, Table 2). Harmonic spectra are
shown with the results of the' Siegel' test for nonequally stepped time-series. Dashed horizontal lines
mark the critical value g" respectively. The dashed lines
in the cross spectra indicate the level of non-zero coherency. The lower graph presents phase relationships
between clay mineral proxies and global ice volume.
Values of '%NADW' (Raymo et al. 1990) and the
kaolinite/chlorite-ratio in PS2082-1 are derived from
Diekmann et al. (1996). All parameters were calculated
at the 95-% significance level, apart from the 80-% significance level for parameter '%NADW'.
cial periods are also evident at core position GeoB
211 0-4, which is located south of the Sao Paolo
Plateau on the South American continental margin, and in the same water depth as the Sao Paulo
Plateau (Fig. 5).
In equatorial Africa, climatic changes, especially
changes of aridity, modified prevailing weathering
regimes and the intensity of hydrolysis, which is the
driving force for pedogenic kaolinite formation.
Aridification reduces the intensity of hydrolysis and
hence kaolinite genesis, but otherwise enhances
wind erosion of paleo-soils kaolinite-bearing soils
as presently observed in the Sahel zone (Aston et
al. 1973). Changes in aridity are usually linked to
the 23-ka periods of precessional forcing (Pokras
and Mix 1985; Prell and Kutzbach 1987; Gingele
1992, 1996). At the Congo River mouth, variations
of fluvial kaolinite discharge were actually in tune
with precessional cycles during the last 200 ka
(Schneider et al. 1997). The time-series analyses