

240
Mackensen and Bickert
"Sample
latitude Longitude Water depth Bott.water F.wuelL F.wuelJ.
1m)
O13C(DIC)
"Ile
oDe
dead
live
GeoB 1514-4
5.14
-46,58
3511
0,87
0,51
GeoD 1513-2
5,43
-46,93
3621
0,85
0,67
GeoB 1512-2
5,90
-48,04
3718
0,78
1,02
PS2215-1
79,70
5,34
2045
1,06
1,13
0,87
PS2214-4
80,29
6,58
562
0,82
PS2213-4
80,29
8,13
874
1,02
PS22 12-6
82,06
15,72
2439
0,96
1,32
1,25
PS2206-4
84,28
-1,84
2993
1,02
1,43
PS2202-4
85,11
-13,72
1083
0,77
1,57
1,36
PS2200-4
85,32
-!3~4
1072
0~2
1,53
PS2185-4
87,53
144,48
1051
1,04
1,38
1,40
PS2182-4
87,58
151,50
2619
1,03
1,37
1~7
PS2181-4
87,60
153,48
3418
1~4
1,48
1,51
PS2183-3
87,61
149,01
2022
1,21
1,28
1,51
PS2184-3
87,61
148,25
1674
1,28
U3
1,31
PS2179-3
87,75
138,16
1228
1,07
1,49
1,48
PS2177-3
88,Q4
134,85
1390
1,04
1,55
PS2186-3
88,51
139,91
1867
1,27
1,53
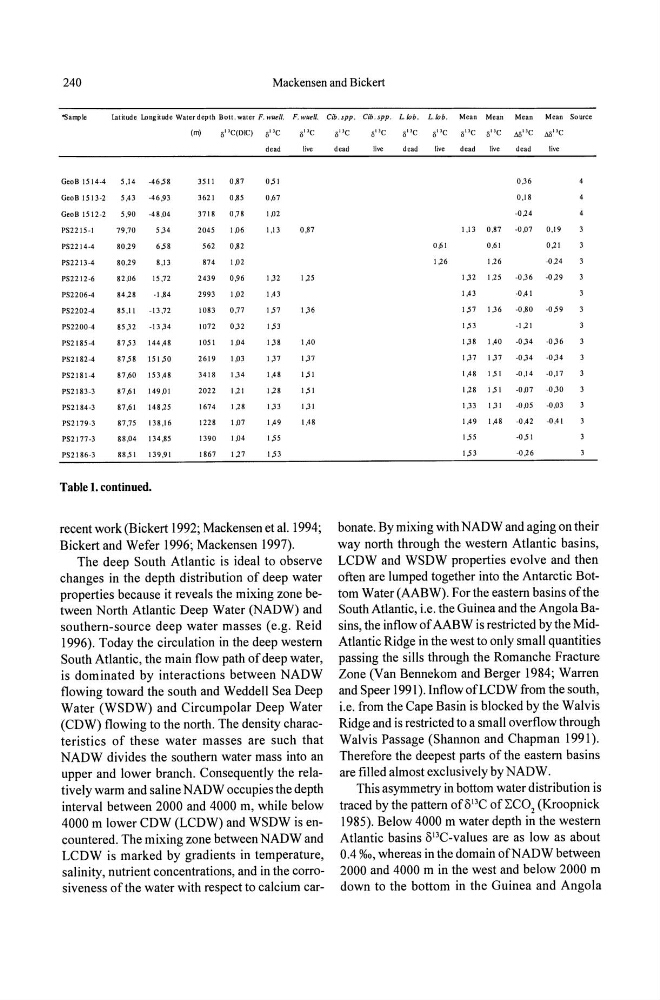
Table 1. continued.
recent work (Bickert 1992; Mackensen et al. 1994;
Bickert and Wefer 1996; Mackensen 1997).
The deep South Atlantic is ideal to observe
changes in the depth distribution of deep water
properties because it reveals the mixing zone between North Atlantic Deep Water (NADW) and
southern-source deep water masses (e.g. Reid
1996). Today the circulation in the deep western
South Atlantic, the main flow path of deep water,
is dominated by interactions between NADW
flowing toward the south and Weddell Sea Deep
Water (WSDW) and Circumpolar Deep Water
(CDW) flowing to the north. The density characteristics of these water masses are such that
NADW divides the southern water mass into an
upper and lower branch. Consequently the relatively warm and saline NADW occupies the depth
interval between 2000 and 4000 m, while below
4000 m lower CDW (LCDW) and WSDW is encountered. The mixing zone between NADW and
LCDW is marked by gradients in temperature,
salinity, nutrient concentrations, and in the corrosiveness of the water with respect to calcium carCib.spp. Cib.spp. L.lnh. L.lnh.
Mean Mean
Mean
Mean Source
OlJC
l/'C
oDe
BIle
s!le olle 6o J3C 6S1'C
dead
live
dead
live
dead
live
dead
live
0~6
0,18
-0,24
1,13 0,87
-0,07
0,19
0,61
0,61
0,21
1,26
1,26
-0,24
1~2
1,25
-0,36
-0,29
1,43
-0,41
1,57
1,36
-0,80
-0,59
1,53
-1,21
1,38
1,40
-0~4
-0~6
1,37
1~7
-0~4
-0~4
1,48
1,51
-0,14
-0,17
1,28
1,51
-0,07
-0,30
1,33
1,31
-0,05
-0,03
1,49
1,48
-0,42
-0,41
1,55
-0,51
1,53
-0,26
bonate. By mixing with NADW and aging on their
way north through the western Atlantic basins,
LCDW and WSDW properties evolve and then
often are lumped together into the Antarctic Bottom Water (AABW). For the eastern basins of the
South Atlantic, i.e. the Guinea and the Angola Basins, the inflow of AABW is restricted by the MidAtlantic Ridge in the west to only small quantities
passing the sills through the Romanche Fracture
Zone (Van Bennekom and Berger 1984; Warren
and Speer 1991). Inflow ofLCDW from the south,
i.e. from the Cape Basin is blocked by the Walvis
Ridge and is restricted to a small overflow through
Walvis Passage (Shannon and Chapman 1991).
Therefore the deepest parts of the eastern basins
are filled almost exclusively by NADW.
This asymmetry in bottom water distribution is
traced by the pattern ofo 13 C ofLC0 2 (Kroopnick
1985). Below 4000 m water depth in the western
Atlantic basins o 13 C-values are as low as about
0.4 %0, whereas in the domain ofNADW between
2000 and 4000 m in the west and below 2000 m
down to the bottom in the Guinea and Angola
Mackensen and Bickert
"Sample
latitude Longitude Water depth Bott.water F.wuelL F.wuelJ.
1m)
O13C(DIC)
"Ile
oDe
dead
live
GeoB 1514-4
5.14
-46,58
3511
0,87
0,51
GeoD 1513-2
5,43
-46,93
3621
0,85
0,67
GeoB 1512-2
5,90
-48,04
3718
0,78
1,02
PS2215-1
79,70
5,34
2045
1,06
1,13
0,87
PS2214-4
80,29
6,58
562
0,82
PS2213-4
80,29
8,13
874
1,02
PS22 12-6
82,06
15,72
2439
0,96
1,32
1,25
PS2206-4
84,28
-1,84
2993
1,02
1,43
PS2202-4
85,11
-13,72
1083
0,77
1,57
1,36
PS2200-4
85,32
-!3~4
1072
0~2
1,53
PS2185-4
87,53
144,48
1051
1,04
1,38
1,40
PS2182-4
87,58
151,50
2619
1,03
1,37
1~7
PS2181-4
87,60
153,48
3418
1~4
1,48
1,51
PS2183-3
87,61
149,01
2022
1,21
1,28
1,51
PS2184-3
87,61
148,25
1674
1,28
U3
1,31
PS2179-3
87,75
138,16
1228
1,07
1,49
1,48
PS2177-3
88,Q4
134,85
1390
1,04
1,55
PS2186-3
88,51
139,91
1867
1,27
1,53
Table 1. continued.
recent work (Bickert 1992; Mackensen et al. 1994;
Bickert and Wefer 1996; Mackensen 1997).
The deep South Atlantic is ideal to observe
changes in the depth distribution of deep water
properties because it reveals the mixing zone between North Atlantic Deep Water (NADW) and
southern-source deep water masses (e.g. Reid
1996). Today the circulation in the deep western
South Atlantic, the main flow path of deep water,
is dominated by interactions between NADW
flowing toward the south and Weddell Sea Deep
Water (WSDW) and Circumpolar Deep Water
(CDW) flowing to the north. The density characteristics of these water masses are such that
NADW divides the southern water mass into an
upper and lower branch. Consequently the relatively warm and saline NADW occupies the depth
interval between 2000 and 4000 m, while below
4000 m lower CDW (LCDW) and WSDW is encountered. The mixing zone between NADW and
LCDW is marked by gradients in temperature,
salinity, nutrient concentrations, and in the corrosiveness of the water with respect to calcium carCib.spp. Cib.spp. L.lnh. L.lnh.
Mean Mean
Mean
Mean Source
OlJC
l/'C
oDe
BIle
s!le olle 6o J3C 6S1'C
dead
live
dead
live
dead
live
dead
live
0~6
0,18
-0,24
1,13 0,87
-0,07
0,19
0,61
0,61
0,21
1,26
1,26
-0,24
1~2
1,25
-0,36
-0,29
1,43
-0,41
1,57
1,36
-0,80
-0,59
1,53
-1,21
1,38
1,40
-0~4
-0~6
1,37
1~7
-0~4
-0~4
1,48
1,51
-0,14
-0,17
1,28
1,51
-0,07
-0,30
1,33
1,31
-0,05
-0,03
1,49
1,48
-0,42
-0,41
1,55
-0,51
1,53
-0,26
bonate. By mixing with NADW and aging on their
way north through the western Atlantic basins,
LCDW and WSDW properties evolve and then
often are lumped together into the Antarctic Bottom Water (AABW). For the eastern basins of the
South Atlantic, i.e. the Guinea and the Angola Basins, the inflow of AABW is restricted by the MidAtlantic Ridge in the west to only small quantities
passing the sills through the Romanche Fracture
Zone (Van Bennekom and Berger 1984; Warren
and Speer 1991). Inflow ofLCDW from the south,
i.e. from the Cape Basin is blocked by the Walvis
Ridge and is restricted to a small overflow through
Walvis Passage (Shannon and Chapman 1991).
Therefore the deepest parts of the eastern basins
are filled almost exclusively by NADW.
This asymmetry in bottom water distribution is
traced by the pattern ofo 13 C ofLC0 2 (Kroopnick
1985). Below 4000 m water depth in the western
Atlantic basins o 13 C-values are as low as about
0.4 %0, whereas in the domain ofNADW between
2000 and 4000 m in the west and below 2000 m
down to the bottom in the Guinea and Angola