

220
Wolffetal.
isotope record. ANN-derived salinities (Fig. 9g)
also have a low amplitude of about 1.2 %0 and show
trends similar to the isotope-derived salinities in
stages 1 through 4. From stage 6 downwards, no
distinct features can be recognized. Salinities from
MAT show an inverse correlation to MAT temperatures (Fig. 11), especially to winter temperatures
(r = -0.66). This observation is discussed later in
more detail.
Fig. 12 shows summer SST, winter SST, and
salinities calculated by MAT as well as ANN-derived salinities for core RC 12-294. Salinities and
temperatures derived from MAT are highly correlated (r = 0.95, Fig. 11) with generally higher tem1.3
61.1
00
~
00 0.9
0.7
o 18 0 w = 0.18*8 - 5.6
.' .
36
salinity (%0)
37
41rn-n"""""TTTTrrrr""",
-0- 39
~
>~ 37
ro
'"
GeoB 1523-1
B
50
100
150
age (kyrs)
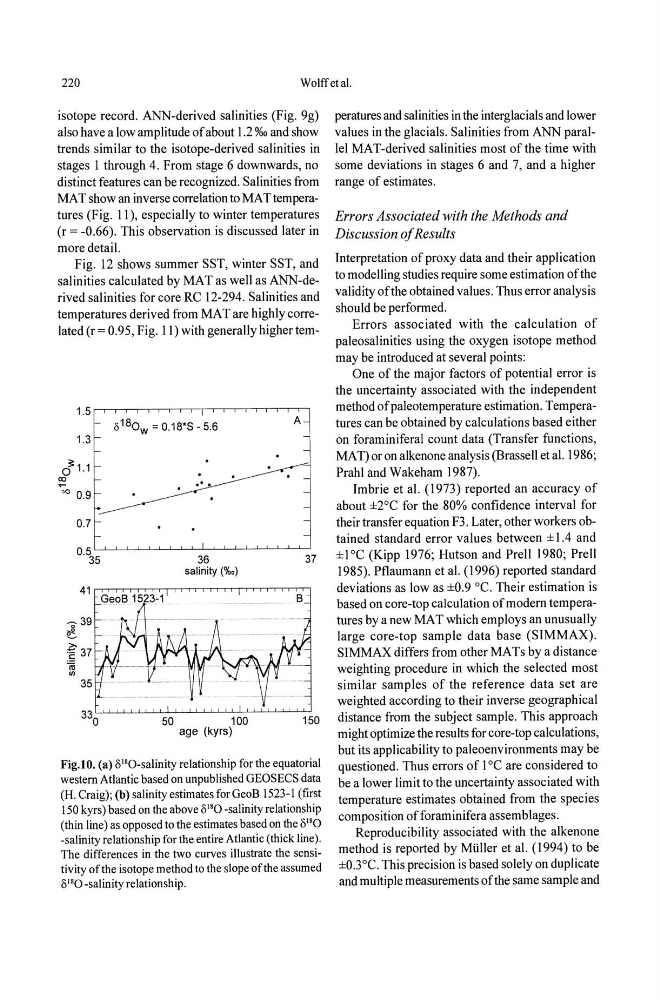
Fig.lO. (a) o"O-salinity relationship for the equatorial
westem Atlantic based on unpublished GEOSECS data
(H. Craig); (b) salinity estimates for GeoB 1523-1 (fIrst
150 kyrs) based on the above 8"0 -salinity relationship
(thin line) as opposed to the estimates based on the 0 1 '0
-salinity relationship for the entire Atlantic (thick line).
The differences in the two curves illustrate the sensitivity ofthe isotope method to the slope ofthe assumed
0 1 '0 -salinity relationship.
peratures and salinities in the interglacials and lower
values in the glacials. Salinities from ANN parallel MAT-derived salinities most of the time with
some deviations in stages 6 and 7, and a higher
range of estimates.
Errors Associated with the Methods and
Discussion a/Results
Interpretation of proxy data and their application
to modelling studies require some estimation ofthe
validity of the obtained values. Thus error analysis
should be performed.
Errors associated with the calculation of
paleo salinities using the oxygen isotope method
may be introduced at several points:
One of the major factors of potential error is
the uncertainty associated with the independent
method of paleotemperature estimation. Temperatures can be obtained by calculations based either
on foraminiferal count data (Transfer functions,
MAT) or on alkenone analysis (Brassell et al. 1986;
Prahl and Wakeham 1987).
Imbrie et al. (1973) reported an accuracy of
about ±2°C for the 80% confidence interval for
their transfer equation F3. Later, other workers obtained standard error values between ± 1.4 and
±l DC (Kipp 1976; Hutson and Prell 1980; Prell
1985). Ptlaumann et al. (1996) reported standard
deviations as low as ±0.9 dc. Their estimation is
based on core-top calculation of modern temperatures by a new MAT which employs an unusually
large core-top sample data base (SIMMAX).
SIMMAX differs from other MATs by a distance
weighting procedure in which the selected most
similar samples of the reference data set are
weighted according to their inverse geographical
distance from the subject sample. This approach
might optimize the results for core-top calculations,
but its applicability to paleoenvironments may be
questioned. Thus errors of 1 DC are considered to
be a lower limit to the uncertainty associated with
temperature estimates obtained from the species
composition of foraminifera assemblages.
Reproducibility associated with the alkenone
method is reported by Muller et al. (1994) to be
±O.3°C. This precision is based solely on duplicate
and multiple measurements of the same sample and
Wolffetal.
isotope record. ANN-derived salinities (Fig. 9g)
also have a low amplitude of about 1.2 %0 and show
trends similar to the isotope-derived salinities in
stages 1 through 4. From stage 6 downwards, no
distinct features can be recognized. Salinities from
MAT show an inverse correlation to MAT temperatures (Fig. 11), especially to winter temperatures
(r = -0.66). This observation is discussed later in
more detail.
Fig. 12 shows summer SST, winter SST, and
salinities calculated by MAT as well as ANN-derived salinities for core RC 12-294. Salinities and
temperatures derived from MAT are highly correlated (r = 0.95, Fig. 11) with generally higher tem1.3
61.1
00
~
00 0.9
0.7
o 18 0 w = 0.18*8 - 5.6
.' .
36
salinity (%0)
37
41rn-n"""""TTTTrrrr""",
-0- 39
~
>~ 37
ro
'"
GeoB 1523-1
B
50
100
150
age (kyrs)
Fig.lO. (a) o"O-salinity relationship for the equatorial
westem Atlantic based on unpublished GEOSECS data
(H. Craig); (b) salinity estimates for GeoB 1523-1 (fIrst
150 kyrs) based on the above 8"0 -salinity relationship
(thin line) as opposed to the estimates based on the 0 1 '0
-salinity relationship for the entire Atlantic (thick line).
The differences in the two curves illustrate the sensitivity ofthe isotope method to the slope ofthe assumed
0 1 '0 -salinity relationship.
peratures and salinities in the interglacials and lower
values in the glacials. Salinities from ANN parallel MAT-derived salinities most of the time with
some deviations in stages 6 and 7, and a higher
range of estimates.
Errors Associated with the Methods and
Discussion a/Results
Interpretation of proxy data and their application
to modelling studies require some estimation ofthe
validity of the obtained values. Thus error analysis
should be performed.
Errors associated with the calculation of
paleo salinities using the oxygen isotope method
may be introduced at several points:
One of the major factors of potential error is
the uncertainty associated with the independent
method of paleotemperature estimation. Temperatures can be obtained by calculations based either
on foraminiferal count data (Transfer functions,
MAT) or on alkenone analysis (Brassell et al. 1986;
Prahl and Wakeham 1987).
Imbrie et al. (1973) reported an accuracy of
about ±2°C for the 80% confidence interval for
their transfer equation F3. Later, other workers obtained standard error values between ± 1.4 and
±l DC (Kipp 1976; Hutson and Prell 1980; Prell
1985). Ptlaumann et al. (1996) reported standard
deviations as low as ±0.9 dc. Their estimation is
based on core-top calculation of modern temperatures by a new MAT which employs an unusually
large core-top sample data base (SIMMAX).
SIMMAX differs from other MATs by a distance
weighting procedure in which the selected most
similar samples of the reference data set are
weighted according to their inverse geographical
distance from the subject sample. This approach
might optimize the results for core-top calculations,
but its applicability to paleoenvironments may be
questioned. Thus errors of 1 DC are considered to
be a lower limit to the uncertainty associated with
temperature estimates obtained from the species
composition of foraminifera assemblages.
Reproducibility associated with the alkenone
method is reported by Muller et al. (1994) to be
±O.3°C. This precision is based solely on duplicate
and multiple measurements of the same sample and