

Clues to Ocean History: a Brief Overview of Proxies
11
Relative
abundance
Paleotemperature (0C)
(%)
Unmodified data
Converted data
Depth
(em)
10 30 50 70 . ,
•
Rei. abund. today
with / without
F. nrgwltMI.
3
5
•
SST today (' C)
- - 093/29/3
-
093128/3
7 ·1
•
,.epwlu
nIInked
3
SST today ('C)
5
- - 093129r1/3
- - 093129r2/3
- - 093129r3f3
contlnuaua
7·'
3
5
7
Isotope
SST today (' C)
stages
- - 0931291g/3
-
D93/1 81g/3
- - 093/301 g/3
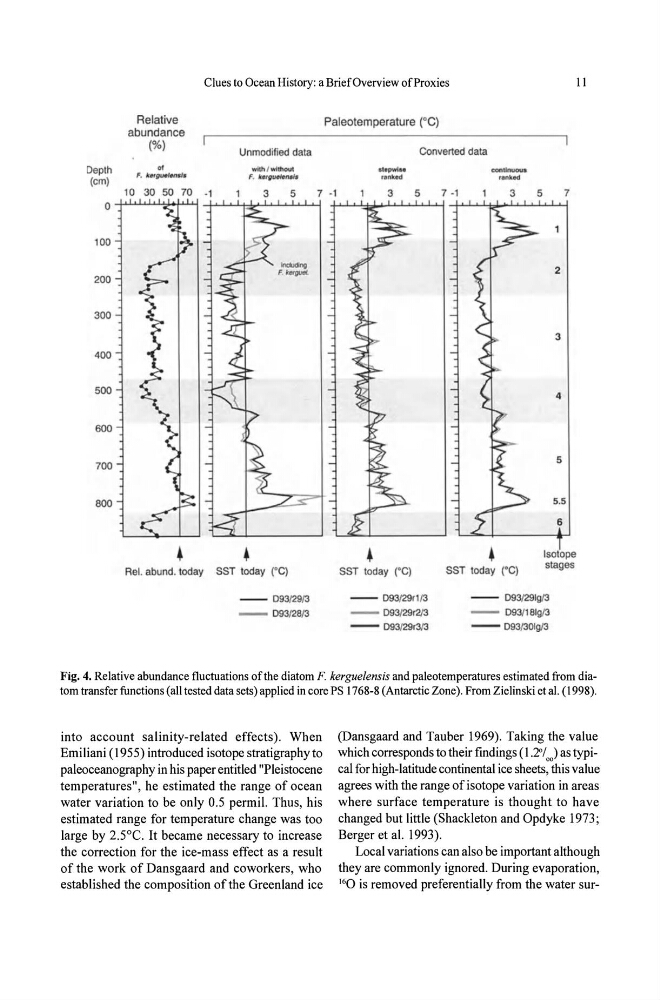
Fig. 4. Relative abundance fluctuations of the diatom F. kerguelensis and paleotemperatures estimated from diatom transfer functions (all tested data sets) applied in core PS 1768-8 (Antarctic Zone). From Zielinski et al. (1998).
into account salinity-related effects). When
Emiliani (l9SS) introduced isotope stratigraphy to
paleoceanography in his paper entitled "Pleistocene
temperatures", he estimated the range of ocean
water variation to be only 0.5 permil. Thus, his
estimated range for temperature change was too
large by 2.S0C. It became necessary to increase
the correction for the ice-mass effect as a result
of the work of Dansgaard and coworkers, who
established the composition of the Greenland ice
(Dansgaard and Tauber 1969). Taking the value
which corresponds to their findings (l :2:'1 00 ) as typical for high-latitude continental ice sheets, this value
agrees with the range of isotope variation in areas
where surface temperature is thought to have
changed but little (Shackleton and Opdyke 1973;
Berger et al. 1993).
Local variations can also be important although
they are commonly ignored. During evaporation,
16 0 is removed preferentially from the water sur-
11
Relative
abundance
Paleotemperature (0C)
(%)
Unmodified data
Converted data
Depth
(em)
10 30 50 70 . ,
•
Rei. abund. today
with / without
F. nrgwltMI.
3
5
•
SST today (' C)
- - 093/29/3
-
093128/3
7 ·1
•
,.epwlu
nIInked
3
SST today ('C)
5
- - 093129r1/3
- - 093129r2/3
- - 093129r3f3
contlnuaua
7·'
3
5
7
Isotope
SST today (' C)
stages
- - 0931291g/3
-
D93/1 81g/3
- - 093/301 g/3
Fig. 4. Relative abundance fluctuations of the diatom F. kerguelensis and paleotemperatures estimated from diatom transfer functions (all tested data sets) applied in core PS 1768-8 (Antarctic Zone). From Zielinski et al. (1998).
into account salinity-related effects). When
Emiliani (l9SS) introduced isotope stratigraphy to
paleoceanography in his paper entitled "Pleistocene
temperatures", he estimated the range of ocean
water variation to be only 0.5 permil. Thus, his
estimated range for temperature change was too
large by 2.S0C. It became necessary to increase
the correction for the ice-mass effect as a result
of the work of Dansgaard and coworkers, who
established the composition of the Greenland ice
(Dansgaard and Tauber 1969). Taking the value
which corresponds to their findings (l :2:'1 00 ) as typical for high-latitude continental ice sheets, this value
agrees with the range of isotope variation in areas
where surface temperature is thought to have
changed but little (Shackleton and Opdyke 1973;
Berger et al. 1993).
Local variations can also be important although
they are commonly ignored. During evaporation,
16 0 is removed preferentially from the water sur-