

Metocean Extreme and Operating Conditions 3.4 Modeling 59
Part A | 3.4
measurements at their site of interest. Calculating extreme criteria, say the 100-y event, from short duration
measurements will give values with extremely large uncertainty and a high likelihood of major bias. Even 12
years of measurements are often inadequate to capture
interannual variability.
3.4.1 Winds
Extratropical wind field calculations generally use
pressure contours on archived meteorological analysis charts as input information. A balance between
the pressure gradient and the Coriolis force gives the
wind speed. That calculation must be modified using
a boundary layer model to find the desired wind speed
and direction at 10 m elevation.
An important modeling hindcast dataset is the
NCEP (National Centers for Environmental Prediction)
reanalysis product [3.83]. The first phase is documented
in Kalnay et al. [3.84] and consists of a numerical
model hindcast of wind and pressure fields from 1948
to the present. Observations from ships, satellites, and
fixed sites have been assimilated into the model. A follow on effort, NCEP/DOE (Department of Energy)
Reanalysis II, covered 19792010 [3.85] and included
far more satellite observations, as well as bias correction and a more refined model. Saha et al. [3.86]
describe the most recent model and processing.
The NCEP data is on a rather coarse grid, so for
storm hindcasts it probably needs to be augmented with
an analysis by an experienced meteorologist using all
available data. Wind speeds derived from satellite scatterometers can be very helpful in this process.
Hurricanes offer a special challenge since they are
small features relative to the scale of regular weather
charts. To compensate for this, kinematic or dynamic
hurricane models are often used to hindcast hurricane
winds. The models typically begin with specification
of the atmospheric pressure field. Winds due to that
pressure field are found from the gradient wind balance
equations. Then the wind is adjusted to 10 m elevation
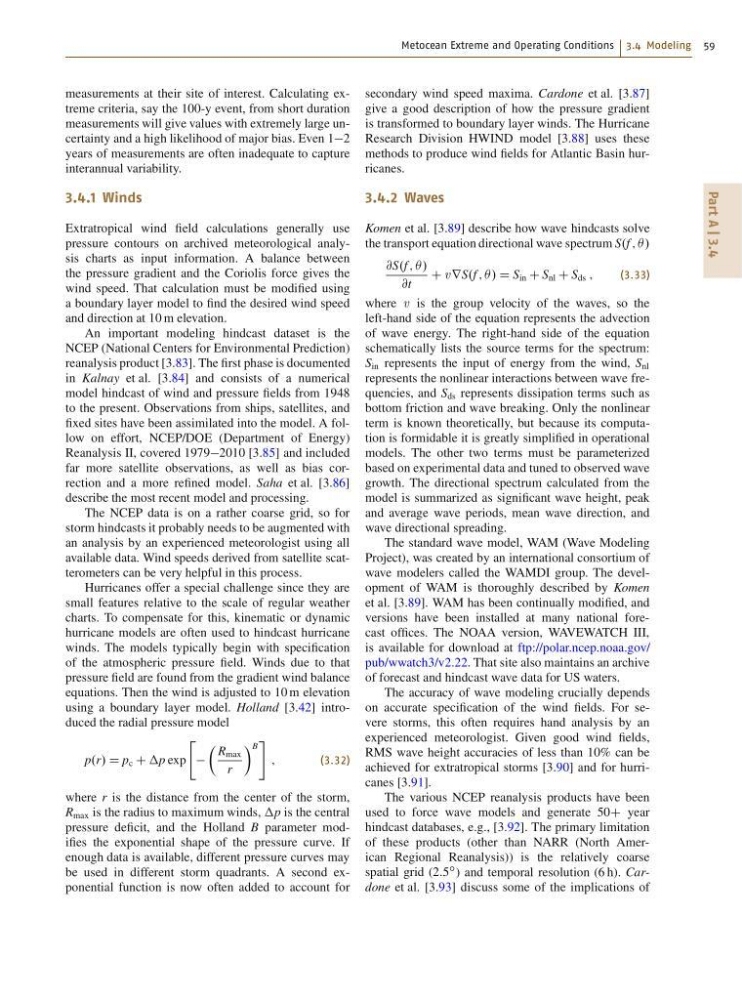
using a boundary layer model. Holland [3.42] introduced the radial pressure model
p.r/ D p c C p exp
"
 R max
r
à B
#
;
(3.32)
where r is the distance from the center of the storm,
R max is the radius to maximum winds, p is the central
pressure deficit, and the Holland B parameter modifies the exponential shape of the pressure curve. If
enough data is available, different pressure curves may
be used in different storm quadrants. A second exponential function is now often added to account for
secondary wind speed maxima. Cardone et al. [3.87]
give a good description of how the pressure gradient
is transformed to boundary layer winds. The Hurricane
Research Division HWIND model [3.88] uses these
methods to produce wind fields for Atlantic Basin hurricanes.
3.4.2 Waves
Komen et al. [3.89] describe how wave hindcasts solve
the transport equation directional wave spectrum S.f ; Â/
@S.f ; Â/
@t
C v rS.f ; Â/ D S in C S nl C S ds ;
(3.33)
where v is the group velocity of the waves, so the
left-hand side of the equation represents the advection
of wave energy. The right-hand side of the equation
schematically lists the source terms for the spectrum:
S in represents the input of energy from the wind, S nl
represents the nonlinear interactions between wave frequencies, and S ds represents dissipation terms such as
bottom friction and wave breaking. Only the nonlinear
term is known theoretically, but because its computation is formidable it is greatly simplified in operational
models. The other two terms must be parameterized
based on experimental data and tuned to observed wave
growth. The directional spectrum calculated from the
model is summarized as significant wave height, peak
and average wave periods, mean wave direction, and
wave directional spreading.
The standard wave model, WAM (Wave Modeling
Project), was created by an international consortium of
wave modelers called the WAMDI group. The development of WAM is thoroughly described by Komen
et al. [3.89]. WAM has been continually modified, and
versions have been installed at many national forecast offices. The NOAA version, WAVEWATCH III,
is available for download at ftp://polar.ncep.noaa.gov/
pub/wwatch3/v2.22. That site also maintains an archive
of forecast and hindcast wave data for US waters.
The accuracy of wave modeling crucially depends
on accurate specification of the wind fields. For severe storms, this often requires hand analysis by an
experienced meteorologist. Given good wind fields,
RMS wave height accuracies of less than 10% can be
achieved for extratropical storms [3.90] and for hurricanes [3.91].
The various NCEP reanalysis products have been
used to force wave models and generate 50C year
hindcast databases, e.g., [3.92]. The primary limitation
of these products (other than NARR (North American Regional Reanalysis)) is the relatively coarse
spatial grid (2:5
ı ) and temporal resolution (6 h). Cardone et al. [3.93] discuss some of the implications of
Part A | 3.4
measurements at their site of interest. Calculating extreme criteria, say the 100-y event, from short duration
measurements will give values with extremely large uncertainty and a high likelihood of major bias. Even 12
years of measurements are often inadequate to capture
interannual variability.
3.4.1 Winds
Extratropical wind field calculations generally use
pressure contours on archived meteorological analysis charts as input information. A balance between
the pressure gradient and the Coriolis force gives the
wind speed. That calculation must be modified using
a boundary layer model to find the desired wind speed
and direction at 10 m elevation.
An important modeling hindcast dataset is the
NCEP (National Centers for Environmental Prediction)
reanalysis product [3.83]. The first phase is documented
in Kalnay et al. [3.84] and consists of a numerical
model hindcast of wind and pressure fields from 1948
to the present. Observations from ships, satellites, and
fixed sites have been assimilated into the model. A follow on effort, NCEP/DOE (Department of Energy)
Reanalysis II, covered 19792010 [3.85] and included
far more satellite observations, as well as bias correction and a more refined model. Saha et al. [3.86]
describe the most recent model and processing.
The NCEP data is on a rather coarse grid, so for
storm hindcasts it probably needs to be augmented with
an analysis by an experienced meteorologist using all
available data. Wind speeds derived from satellite scatterometers can be very helpful in this process.
Hurricanes offer a special challenge since they are
small features relative to the scale of regular weather
charts. To compensate for this, kinematic or dynamic
hurricane models are often used to hindcast hurricane
winds. The models typically begin with specification
of the atmospheric pressure field. Winds due to that
pressure field are found from the gradient wind balance
equations. Then the wind is adjusted to 10 m elevation
using a boundary layer model. Holland [3.42] introduced the radial pressure model
p.r/ D p c C p exp
"
 R max
r
à B
#
;
(3.32)
where r is the distance from the center of the storm,
R max is the radius to maximum winds, p is the central
pressure deficit, and the Holland B parameter modifies the exponential shape of the pressure curve. If
enough data is available, different pressure curves may
be used in different storm quadrants. A second exponential function is now often added to account for
secondary wind speed maxima. Cardone et al. [3.87]
give a good description of how the pressure gradient
is transformed to boundary layer winds. The Hurricane
Research Division HWIND model [3.88] uses these
methods to produce wind fields for Atlantic Basin hurricanes.
3.4.2 Waves
Komen et al. [3.89] describe how wave hindcasts solve
the transport equation directional wave spectrum S.f ; Â/
@S.f ; Â/
@t
C v rS.f ; Â/ D S in C S nl C S ds ;
(3.33)
where v is the group velocity of the waves, so the
left-hand side of the equation represents the advection
of wave energy. The right-hand side of the equation
schematically lists the source terms for the spectrum:
S in represents the input of energy from the wind, S nl
represents the nonlinear interactions between wave frequencies, and S ds represents dissipation terms such as
bottom friction and wave breaking. Only the nonlinear
term is known theoretically, but because its computation is formidable it is greatly simplified in operational
models. The other two terms must be parameterized
based on experimental data and tuned to observed wave
growth. The directional spectrum calculated from the
model is summarized as significant wave height, peak
and average wave periods, mean wave direction, and
wave directional spreading.
The standard wave model, WAM (Wave Modeling
Project), was created by an international consortium of
wave modelers called the WAMDI group. The development of WAM is thoroughly described by Komen
et al. [3.89]. WAM has been continually modified, and
versions have been installed at many national forecast offices. The NOAA version, WAVEWATCH III,
is available for download at ftp://polar.ncep.noaa.gov/
pub/wwatch3/v2.22. That site also maintains an archive
of forecast and hindcast wave data for US waters.
The accuracy of wave modeling crucially depends
on accurate specification of the wind fields. For severe storms, this often requires hand analysis by an
experienced meteorologist. Given good wind fields,
RMS wave height accuracies of less than 10% can be
achieved for extratropical storms [3.90] and for hurricanes [3.91].
The various NCEP reanalysis products have been
used to force wave models and generate 50C year
hindcast databases, e.g., [3.92]. The primary limitation
of these products (other than NARR (North American Regional Reanalysis)) is the relatively coarse
spatial grid (2:5
ı ) and temporal resolution (6 h). Cardone et al. [3.93] discuss some of the implications of