

Part C | 32.4
724 Part C Coastal Design
0
1
ρ e
ρ a
Sea surface
(elevation z SL )
Rosette style
outfall structure
Nozzle
Riser
Outfall shaft
Conduit (pipe or tunnel)
Diffuser
(or manifold)
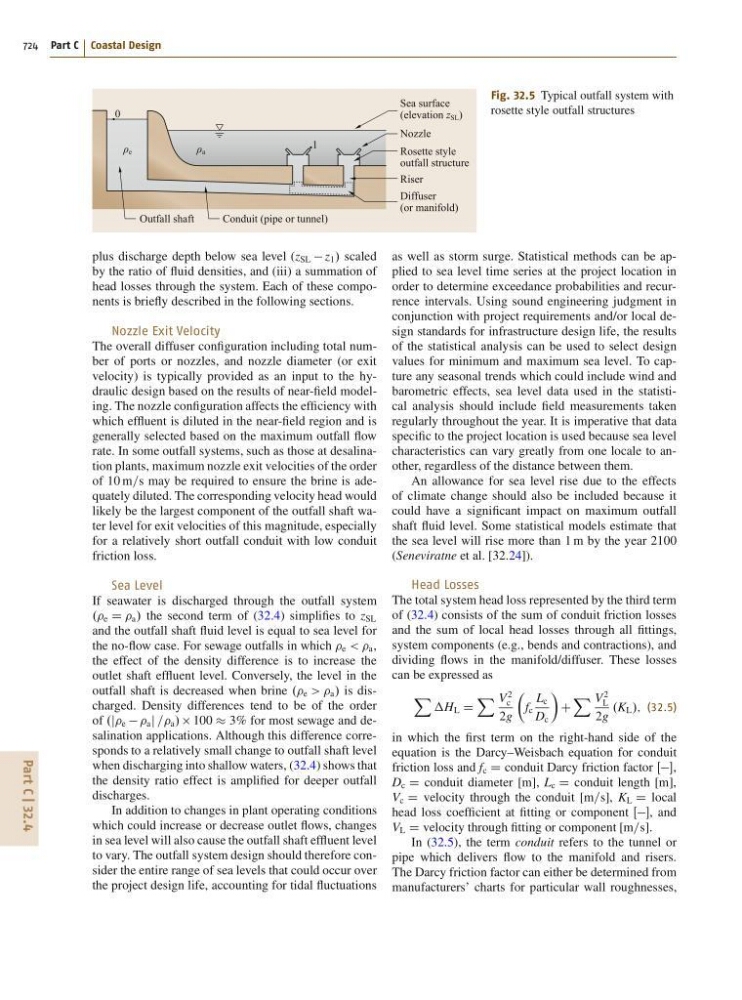
Fig. 32.5 Typical outfall system with
rosette style outfall structures
plus discharge depth below sea level (z SL z 1 / scaled
by the ratio of fluid densities, and (iii) a summation of
head losses through the system. Each of these components is briefly described in the following sections.
Nozzle Exit Velocity
The overall diffuser configuration including total number of ports or nozzles, and nozzle diameter (or exit
velocity) is typically provided as an input to the hydraulic design based on the results of near-field modeling. The nozzle configuration affects the efficiency with
which effluent is diluted in the near-field region and is
generally selected based on the maximum outfall flow
rate. In some outfall systems, such as those at desalination plants, maximum nozzle exit velocities of the order
of 10 m=s may be required to ensure the brine is adequately diluted. The corresponding velocity head would
likely be the largest component of the outfall shaft water level for exit velocities of this magnitude, especially
for a relatively short outfall conduit with low conduit
friction loss.
Sea Level
If seawater is discharged through the outfall system
.. e D a / the second term of (32.4) simplifies to z SL
and the outfall shaft fluid level is equal to sea level for
the no-flow case. For sewage outfalls in which e < < a ,
the effect of the density difference is to increase the
outlet shaft effluent level. Conversely, the level in the
outfall shaft is decreased when brine .. e > > a / is discharged. Density differences tend to be of the order
of .j e a j == a / 100 3% for most sewage and desalination applications. Although this difference corresponds to a relatively small change to outfall shaft level
when discharging into shallow waters, (32.4) shows that
the density ratio effect is amplified for deeper outfall
discharges.
In addition to changes in plant operating conditions
which could increase or decrease outlet flows, changes
in sea level will also cause the outfall shaft effluent level
to vary. The outfall system design should therefore consider the entire range of sea levels that could occur over
the project design life, accounting for tidal fluctuations
as well as storm surge. Statistical methods can be applied to sea level time series at the project location in
order to determine exceedance probabilities and recurrence intervals. Using sound engineering judgment in
conjunction with project requirements and/or local design standards for infrastructure design life, the results
of the statistical analysis can be used to select design
values for minimum and maximum sea level. To capture any seasonal trends which could include wind and
barometric effects, sea level data used in the statistical analysis should include field measurements taken
regularly throughout the year. It is imperative that data
specific to the project location is used because sea level
characteristics can vary greatly from one locale to another, regardless of the distance between them.
An allowance for sea level rise due to the effects
of climate change should also be included because it
could have a significant impact on maximum outfall
shaft fluid level. Some statistical models estimate that
the sea level will rise more than 1 m by the year 2100
(Seneviratne et al. [32.24]).
Head Losses
The total system head loss represented by the third term
of (32.4) consists of the sum of conduit friction losses
and the sum of local head losses through all fittings,
system components (e.g., bends and contractions), and
dividing flows in the manifold/diffuser. These losses
can be expressed as
X
H L D
X V
2
c
2g
Â
f c
L c
D c
Ã
C
X V
2
L
2g
.K L /; (32.5)
in which the first term on the right-hand side of the
equation is the Darcy–Weisbach equation for conduit
friction loss and f c D conduit Darcy friction factor Œ,
D c D conduit diameter [m], L c D conduit length [m],
V c D velocity through the conduit [m=s], K L D local
head loss coefficient at fitting or component Œ, and
V L D velocity through fitting or component [m=s].
In (32.5), the term conduit refers to the tunnel or
pipe which delivers flow to the manifold and risers.
The Darcy friction factor can either be determined from
manufacturers’ charts for particular wall roughnesses,