

Statistical Characterization of Hazards and Risk in Coastal Areas 26.3 Historical Perspective 585
Part C | 26.3
y = 1.0096 x
R
2 = 0.931547
y = 1.04454 x
R
2 = 0.889743
0 2 4 6 8 10 12 14 16 18 20 22 24 26 28
a) Predicted peak value (ft)
Measured peak value (ft)
28
26
24
22
20
18
16
14
12
10
8
6
4
2
0
0 2 4 6 8 10 12 14 16 18 20 22 24 26 28
b) Predicted peak value (ft)
Measured peak value (ft)
28
26
24
22
20
18
16
14
12
10
8
6
4
2
0
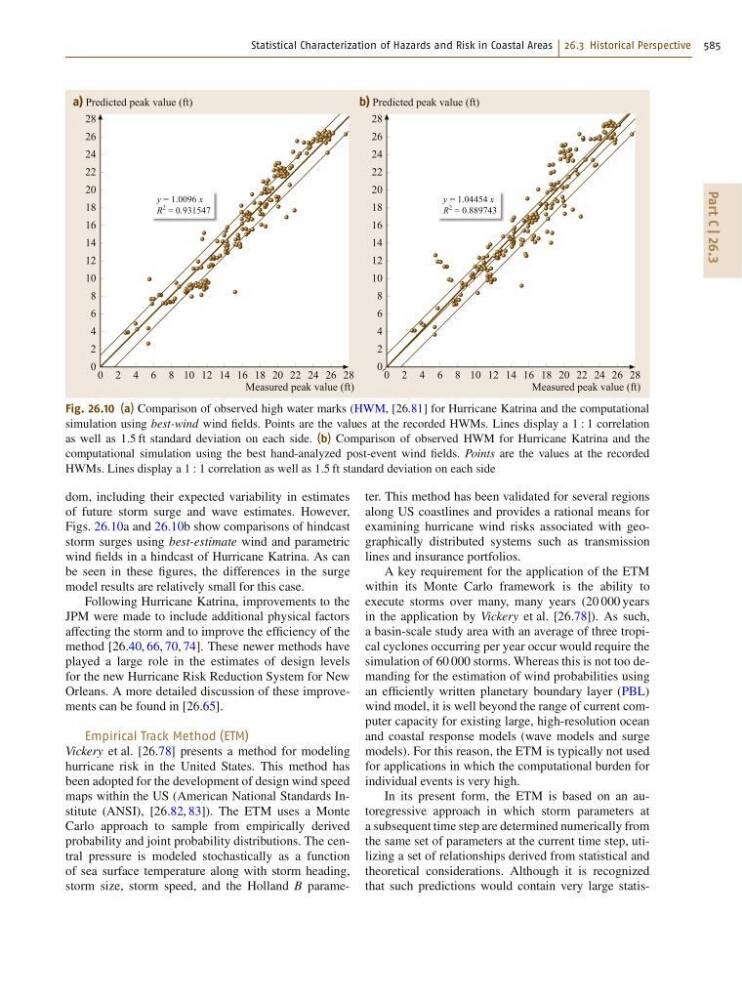
Fig. 26.10 (a) Comparison of observed high water marks (HWM, [26.81] for Hurricane Katrina and the computational
simulation using best-wind wind fields. Points are the values at the recorded HWMs. Lines display a 1 W 1 correlation
as well as 1:5 ft standard deviation on each side. (b) Comparison of observed HWM for Hurricane Katrina and the
computational simulation using the best hand-analyzed post-event wind fields. Points are the values at the recorded
HWMs. Lines display a 1 W 1 correlation as well as 1:5 ft standard deviation on each side
dom, including their expected variability in estimates
of future storm surge and wave estimates. However,
Figs. 26.10a and 26.10b show comparisons of hindcast
storm surges using best-estimate wind and parametric
wind fields in a hindcast of Hurricane Katrina. As can
be seen in these figures, the differences in the surge
model results are relatively small for this case.
Following Hurricane Katrina, improvements to the
JPM were made to include additional physical factors
affecting the storm and to improve the efficiency of the
method [26.40, 66, 70, 74]. These newer methods have
played a large role in the estimates of design levels
for the new Hurricane Risk Reduction System for New
Orleans. A more detailed discussion of these improvements can be found in [26.65].
Empirical Track Method (ETM)
Vickery et al. [26.78] presents a method for modeling
hurricane risk in the United States. This method has
been adopted for the development of design wind speed
maps within the US (American National Standards Institute (ANSI), [26.82, 83]). The ETM uses a Monte
Carlo approach to sample from empirically derived
probability and joint probability distributions. The central pressure is modeled stochastically as a function
of sea surface temperature along with storm heading,
storm size, storm speed, and the Holland B parameter. This method has been validated for several regions
along US coastlines and provides a rational means for
examining hurricane wind risks associated with geographically distributed systems such as transmission
lines and insurance portfolios.
A key requirement for the application of the ETM
within its Monte Carlo framework is the ability to
execute storms over many, many years (20 000 years
in the application by Vickery et al. [26.78]). As such,
a basin-scale study area with an average of three tropical cyclones occurring per year occur would require the
simulation of 60 000 storms. Whereas this is not too demanding for the estimation of wind probabilities using
an efficiently written planetary boundary layer (PBL)
wind model, it is well beyond the range of current computer capacity for existing large, high-resolution ocean
and coastal response models (wave models and surge
models). For this reason, the ETM is typically not used
for applications in which the computational burden for
individual events is very high.
In its present form, the ETM is based on an autoregressive approach in which storm parameters at
a subsequent time step are determined numerically from
the same set of parameters at the current time step, utilizing a set of relationships derived from statistical and
theoretical considerations. Although it is recognized
that such predictions would contain very large statis-