

Physical Characteristics of Coastal Hazards 25.2 Coastal Impacts 557
Part C | 25.2
R max = 10 km
R max = 50 km
R max = 100 km
V f = 2 m/s
R max = 10 km
R max = 50 km
R max = 100 km
V f = 5 m/s
R max = 10 km
R max = 50 km
R max = 100 km
V f = 10 m/s
30
35
40
45
50
55
60
a) H s (m)
U a–max (m/s)
30
25
20
15
10
5
0
30
35
40
45
50
55
60
b) H s (m)
U a–max (m/s)
30
25
20
15
10
5
0
30
35
40
45
50
55
60
c) H s (m)
U a–max (m/s)
30
25
20
15
10
5
0
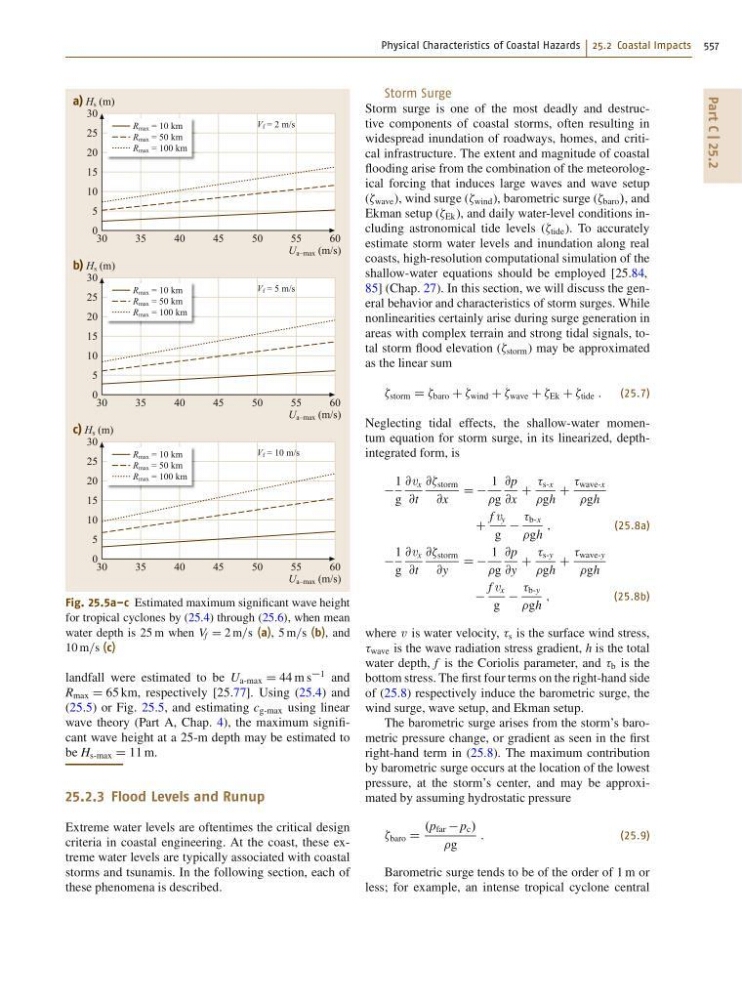
Fig. 25.5a–c Estimated maximum significant wave height
for tropical cyclones by (25.4) through (25.6), when mean
water depth is 25 m when V f D 2 m=s (a), 5 m=s (b), and
10 m=s (c)
landfall were estimated to be U a-max D 44 m s
1 and
R max D 65 km, respectively [25.77]. Using (25.4) and
(25.5) or Fig. 25.5, and estimating c g-max using linear
wave theory (Part A, Chap. 4), the maximum significant wave height at a 25-m depth may be estimated to
be H s-max D 11 m.
25.2.3 Flood Levels and Runup
Extreme water levels are oftentimes the critical design
criteria in coastal engineering. At the coast, these extreme water levels are typically associated with coastal
storms and tsunamis. In the following section, each of
these phenomena is described.
Storm Surge
Storm surge is one of the most deadly and destructive components of coastal storms, often resulting in
widespread inundation of roadways, homes, and critical infrastructure. The extent and magnitude of coastal
flooding arise from the combination of the meteorological forcing that induces large waves and wave setup
( wave ), wind surge ( wind ), barometric surge ( baro /, and
Ekman setup ( Ek ), and daily water-level conditions including astronomical tide levels ( tide ). To accurately
estimate storm water levels and inundation along real
coasts, high-resolution computational simulation of the
shallow-water equations should be employed [25.84,
85] (Chap. 27). In this section, we will discuss the general behavior and characteristics of storm surges. While
nonlinearities certainly arise during surge generation in
areas with complex terrain and strong tidal signals, total storm flood elevation ( storm ) may be approximated
as the linear sum
storm D baro C wind C wave C Ek C tide : (25.7)
Neglecting tidal effects, the shallow-water momentum equation for storm surge, in its linearized, depthintegrated form, is
1
g
@v x
@t
@@ storm
@x
D D
1
g
@p
@x
C
s-x
gh
C
wave-x
gh
C
f v y
g
b-x
gh
;
(25.8a)
1
g
@v x
@t
@@ storm
@y
D D
1
g
@p
@y
C
s-y
gh
C
wave-y
gh
f v x
g
b-y
gh
;
(25.8b)
where v is water velocity, s is the surface wind stress,
wave is the wave radiation stress gradient, h is the total
water depth, f is the Coriolis parameter, and b is the
bottom stress. The first four terms on the right-hand side
of (25.8) respectively induce the barometric surge, the
wind surge, wave setup, and Ekman setup.
The barometric surge arises from the storm’s barometric pressure change, or gradient as seen in the first
right-hand term in (25.8). The maximum contribution
by barometric surge occurs at the location of the lowest
pressure, at the storm’s center, and may be approximated by assuming hydrostatic pressure
baro D
.p far p c /
g
:
(25.9)
Barometric surge tends to be of the order of 1 m or
less; for example, an intense tropical cyclone central