

Autonomy: Risk Assessment 24.5 Risk of Loss 535
Part B | 24.5
Dr
X 2
S
X 10
F
X 9
Sc
X 11
Dp
X 1
L
X 7
Dv
X 4
O
X 3
Sh
X 5
U
X 6
R
X 8
p 11,11
p 10,11
p 7,9
p 2,10
p 7,10
p 4,7
p 3,7
p 7,7
p 2,3
p 9,1
p 9,11
p 10,1
p 1,2
p 3,4
p 5,7
p 6,7
p 8,7
p 4,5
p 5,6
p 1,1
p 3,8
p 8,1
p 2,1
p 4,8
p 5,8
p 6,8
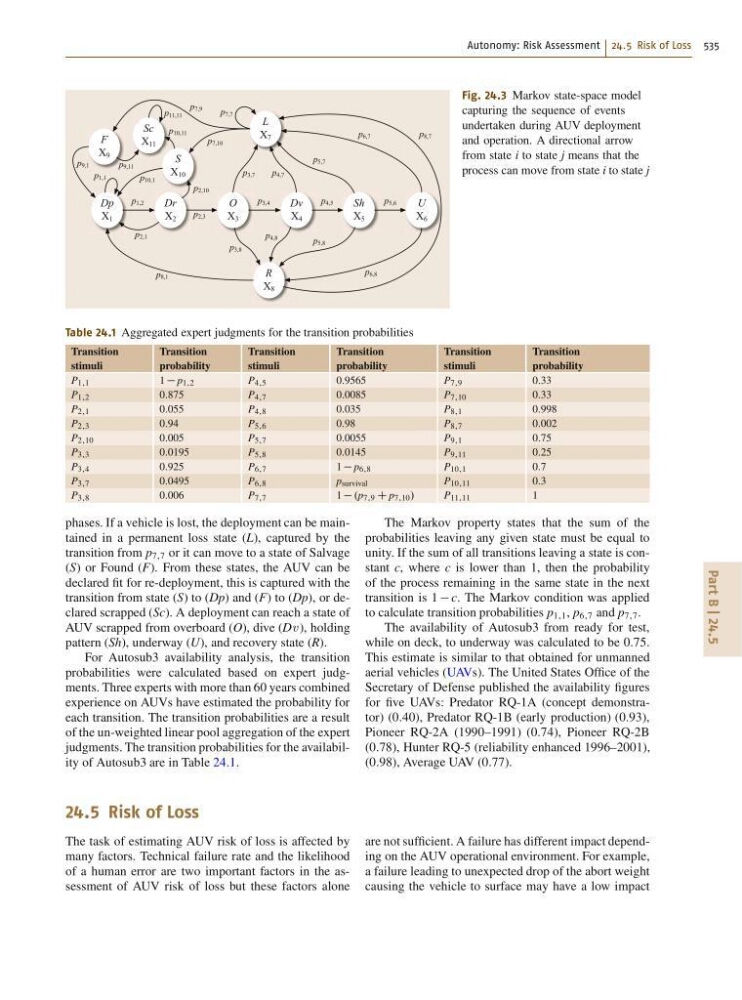
Fig. 24.3 Markov state-space model
capturing the sequence of events
undertaken during AUV deployment
and operation. A directional arrow
from state i to state j means that the
process can move from state i to state j
Table 24.1 Aggregated expert judgments for the transition probabilities
Transition
Transition
Transition
Transition
Transition
Transition
stimuli
probability
stimuli
probability
stimuli
probability
P 1;1
1 p 1;2
P 4;5
0:9565
P 7;9
0:33
P 1;2
0:875
P 4;7
0:0085
P 7;10
0:33
P 2;1
0:055
P 4;8
0:035
P 8;1
0:998
P 2;3
0:94
P 5;6
0:98
P 8;7
0:002
P 2;10
0:005
P 5;7
0:0055
P 9;1
0:75
P 3;3
0:0195
P 5;8
0:0145
P 9;11
0:25
P 3;4
0:925
P 6;7
1 p 6;8
P 10;1
0:7
P 3;7
0:0495
P 6;8
p survival
P 10;11
0:3
P 3;8
0:006
P 7;7
1 .p 7;9 C p 7;10 /
P 11;11
1
phases. If a vehicle is lost, the deployment can be maintained in a permanent loss state (L), captured by the
transition from p 7;7 or it can move to a state of Salvage
(S) or Found (F). From these states, the AUV can be
declared fit for re-deployment, this is captured with the
transition from state (S) to (Dp) and (F) to (Dp), or declared scrapped (Sc). A deployment can reach a state of
AUV scrapped from overboard (O), dive (Dv ), holding
pattern (Sh), underway (U), and recovery state (R).
For Autosub3 availability analysis, the transition
probabilities were calculated based on expert judgments. Three experts with more than 60 years combined
experience on AUVs have estimated the probability for
each transition. The transition probabilities are a result
of the un-weighted linear pool aggregation of the expert
judgments. The transition probabilities for the availability of Autosub3 are in Table 24.1.
The Markov property states that the sum of the
probabilities leaving any given state must be equal to
unity. If the sum of all transitions leaving a state is constant c, where c is lower than 1, then the probability
of the process remaining in the same state in the next
transition is 1 c. The Markov condition was applied
to calculate transition probabilities p 1;1 , p 6;7 and p 7;7 .
The availability of Autosub3 from ready for test,
while on deck, to underway was calculated to be 0:75.
This estimate is similar to that obtained for unmanned
aerial vehicles (UAVs). The United States Office of the
Secretary of Defense published the availability figures
for five UAVs: Predator RQ-1A (concept demonstrator) (0:40), Predator RQ-1B (early production) (0:93),
Pioneer RQ-2A (1990–1991) (0:74), Pioneer RQ-2B
(0:78), Hunter RQ-5 (reliability enhanced 1996–2001),
(0:98), Average UAV (0:77).
24.5 Risk of Loss
The task of estimating AUV risk of loss is affected by
many factors. Technical failure rate and the likelihood
of a human error are two important factors in the assessment of AUV risk of loss but these factors alone
are not sufficient. A failure has different impact depending on the AUV operational environment. For example,
a failure leading to unexpected drop of the abort weight
causing the vehicle to surface may have a low impact