

Cooperative Vehicle Environmental Monitoring 19.3 Advances in Cooperative Vehicle Ocean Monitoring 451
Part B | 19.3
a) Latitude (°)
b) Latitude (°)
–122.6 –122.5 –122.4 –122.3 –122.2
Longitude (°)
37.15
37.1
37.05
37
36.95
36.9
36.85
36.8
–122.8
10 km
–122.6
–122.4
–122.2
Longitude (°)
37.3
37.2
37.1
37
36.9
36.8
36.7
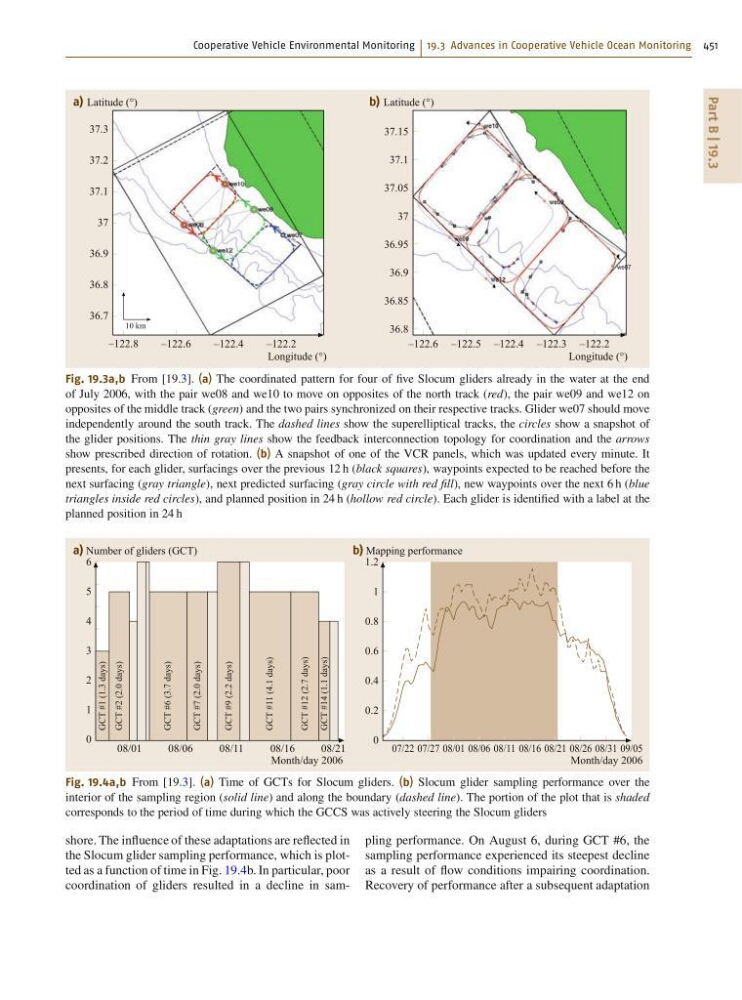
Fig. 19.3a,b From [19.3]. (a) The coordinated pattern for four of five Slocum gliders already in the water at the end
of July 2006, with the pair we08 and we10 to move on opposites of the north track (red), the pair we09 and we12 on
opposites of the middle track (green) and the two pairs synchronized on their respective tracks. Glider we07 should move
independently around the south track. The dashed lines show the superelliptical tracks, the circles show a snapshot of
the glider positions. The thin gray lines show the feedback interconnection topology for coordination and the arrows
show prescribed direction of rotation. (b) A snapshot of one of the VCR panels, which was updated every minute. It
presents, for each glider, surfacings over the previous 12 h (black squares), waypoints expected to be reached before the
next surfacing (gray triangle), next predicted surfacing (gray circle with red fill), new waypoints over the next 6 h (blue
triangles inside red circles), and planned position in 24 h (hollow red circle). Each glider is identified with a label at the
planned position in 24 h
08/01
08/06
08/11
08/16
08/21
a) Number of gliders (GCT)
GCT #1 (1.3 days)
GCT #2 (2.0 days)
GCT #6 (3.7 days)
GCT #7 (2.0 days)
GCT #9 (2.2 days)
GCT #11 (4.1 days)
GCT #14 (1.1 days)
GCT #12 (2.7 days)
Month/day 2006
6
5
4
3
2
1
0
07/22
08/06
08/01
07/27
08/16
08/11
08/31
08/26
08/21
09/05
b) Mapping performance
Month/day 2006
1.2
1
0.8
0.6
0.4
0.2
0
Fig. 19.4a,b From [19.3]. (a) Time of GCTs for Slocum gliders. (b) Slocum glider sampling performance over the
interior of the sampling region (solid line) and along the boundary (dashed line). The portion of the plot that is shaded
corresponds to the period of time during which the GCCS was actively steering the Slocum gliders
shore. The influence of these adaptations are reflected in
the Slocum glider sampling performance, which is plotted as a function of time in Fig. 19.4b. In particular, poor
coordination of gliders resulted in a decline in sampling performance. On August 6, during GCT #6, the
sampling performance experienced its steepest decline
as a result of flow conditions impairing coordination.
Recovery of performance after a subsequent adaptation
Part B | 19.3
a) Latitude (°)
b) Latitude (°)
–122.6 –122.5 –122.4 –122.3 –122.2
Longitude (°)
37.15
37.1
37.05
37
36.95
36.9
36.85
36.8
–122.8
10 km
–122.6
–122.4
–122.2
Longitude (°)
37.3
37.2
37.1
37
36.9
36.8
36.7
Fig. 19.3a,b From [19.3]. (a) The coordinated pattern for four of five Slocum gliders already in the water at the end
of July 2006, with the pair we08 and we10 to move on opposites of the north track (red), the pair we09 and we12 on
opposites of the middle track (green) and the two pairs synchronized on their respective tracks. Glider we07 should move
independently around the south track. The dashed lines show the superelliptical tracks, the circles show a snapshot of
the glider positions. The thin gray lines show the feedback interconnection topology for coordination and the arrows
show prescribed direction of rotation. (b) A snapshot of one of the VCR panels, which was updated every minute. It
presents, for each glider, surfacings over the previous 12 h (black squares), waypoints expected to be reached before the
next surfacing (gray triangle), next predicted surfacing (gray circle with red fill), new waypoints over the next 6 h (blue
triangles inside red circles), and planned position in 24 h (hollow red circle). Each glider is identified with a label at the
planned position in 24 h
08/01
08/06
08/11
08/16
08/21
a) Number of gliders (GCT)
GCT #1 (1.3 days)
GCT #2 (2.0 days)
GCT #6 (3.7 days)
GCT #7 (2.0 days)
GCT #9 (2.2 days)
GCT #11 (4.1 days)
GCT #14 (1.1 days)
GCT #12 (2.7 days)
Month/day 2006
6
5
4
3
2
1
0
07/22
08/06
08/01
07/27
08/16
08/11
08/31
08/26
08/21
09/05
b) Mapping performance
Month/day 2006
1.2
1
0.8
0.6
0.4
0.2
0
Fig. 19.4a,b From [19.3]. (a) Time of GCTs for Slocum gliders. (b) Slocum glider sampling performance over the
interior of the sampling region (solid line) and along the boundary (dashed line). The portion of the plot that is shaded
corresponds to the period of time during which the GCCS was actively steering the Slocum gliders
shore. The influence of these adaptations are reflected in
the Slocum glider sampling performance, which is plotted as a function of time in Fig. 19.4b. In particular, poor
coordination of gliders resulted in a decline in sampling performance. On August 6, during GCT #6, the
sampling performance experienced its steepest decline
as a result of flow conditions impairing coordination.
Recovery of performance after a subsequent adaptation