

Cooperative Vehicle Environmental Monitoring 19.3 Advances in Cooperative Vehicle Ocean Monitoring 447
Part B | 19.3
122.4 W 122.35 W 122.3 W 122.25 W 122.2 W
10 m/s
a) Latitude (°)
Longitude (°)
37.00 N
36.98 N
36.96 N
36.94 N
36.92 N
36.9 N
36.88 N
36.86 N
36.84 N
36.82 N
36.8 N
16.5
16
15.5
15
14.5
14
13.5
13
12.5
12
11.5
122.4 W 122.35 W 122.3 W 122.25 W 122.2 W
10 m/s
b) Latitude (°)
Longitude (°)
37.00 N
36.98 N
36.96 N
36.94 N
36.92 N
36.9 N
36.88 N
36.86 N
36.84 N
36.82 N
36.8 N
16.5
16
15.5
15
14.5
14
13.5
13
12.5
12
11.5
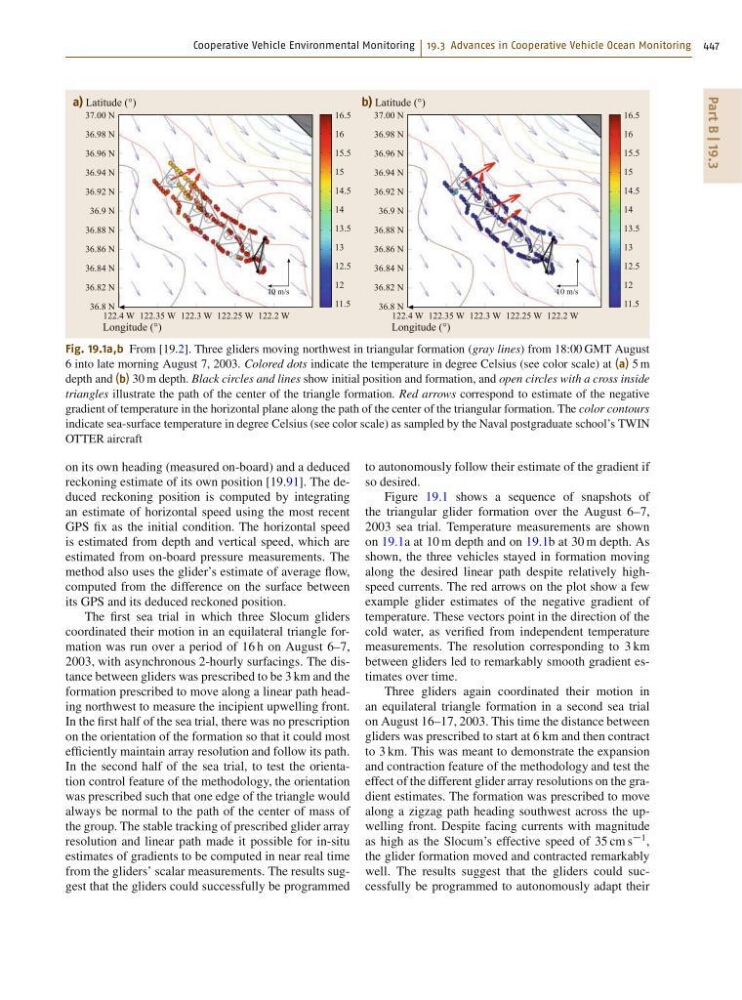
Fig. 19.1a,b From [19.2]. Three gliders moving northwest in triangular formation (gray lines) from 18:00 GMT August
6 into late morning August 7, 2003. Colored dots indicate the temperature in degree Celsius (see color scale) at (a) 5 m
depth and (b) 30 m depth. Black circles and lines show initial position and formation, and open circles with a cross inside
triangles illustrate the path of the center of the triangle formation. Red arrows correspond to estimate of the negative
gradient of temperature in the horizontal plane along the path of the center of the triangular formation. The color contours
indicate sea-surface temperature in degree Celsius (see color scale) as sampled by the Naval postgraduate school’s TWIN
OTTER aircraft
on its own heading (measured on-board) and a deduced
reckoning estimate of its own position [19.91]. The deduced reckoning position is computed by integrating
an estimate of horizontal speed using the most recent
GPS fix as the initial condition. The horizontal speed
is estimated from depth and vertical speed, which are
estimated from on-board pressure measurements. The
method also uses the glider’s estimate of average flow,
computed from the difference on the surface between
its GPS and its deduced reckoned position.
The first sea trial in which three Slocum gliders
coordinated their motion in an equilateral triangle formation was run over a period of 16 h on August 6–7,
2003, with asynchronous 2-hourly surfacings. The distance between gliders was prescribed to be 3 km and the
formation prescribed to move along a linear path heading northwest to measure the incipient upwelling front.
In the first half of the sea trial, there was no prescription
on the orientation of the formation so that it could most
efficiently maintain array resolution and follow its path.
In the second half of the sea trial, to test the orientation control feature of the methodology, the orientation
was prescribed such that one edge of the triangle would
always be normal to the path of the center of mass of
the group. The stable tracking of prescribed glider array
resolution and linear path made it possible for in-situ
estimates of gradients to be computed in near real time
from the gliders’ scalar measurements. The results suggest that the gliders could successfully be programmed
to autonomously follow their estimate of the gradient if
so desired.
Figure 19.1 shows a sequence of snapshots of
the triangular glider formation over the August 6–7,
2003 sea trial. Temperature measurements are shown
on 19.1a at 10 m depth and on 19.1b at 30 m depth. As
shown, the three vehicles stayed in formation moving
along the desired linear path despite relatively highspeed currents. The red arrows on the plot show a few
example glider estimates of the negative gradient of
temperature. These vectors point in the direction of the
cold water, as verified from independent temperature
measurements. The resolution corresponding to 3 km
between gliders led to remarkably smooth gradient estimates over time.
Three gliders again coordinated their motion in
an equilateral triangle formation in a second sea trial
on August 16–17, 2003. This time the distance between
gliders was prescribed to start at 6 km and then contract
to 3 km. This was meant to demonstrate the expansion
and contraction feature of the methodology and test the
effect of the different glider array resolutions on the gradient estimates. The formation was prescribed to move
along a zigzag path heading southwest across the upwelling front. Despite facing currents with magnitude
as high as the Slocum’s effective speed of 35 cm s
1 ,
the glider formation moved and contracted remarkably
well. The results suggest that the gliders could successfully be programmed to autonomously adapt their
Part B | 19.3
122.4 W 122.35 W 122.3 W 122.25 W 122.2 W
10 m/s
a) Latitude (°)
Longitude (°)
37.00 N
36.98 N
36.96 N
36.94 N
36.92 N
36.9 N
36.88 N
36.86 N
36.84 N
36.82 N
36.8 N
16.5
16
15.5
15
14.5
14
13.5
13
12.5
12
11.5
122.4 W 122.35 W 122.3 W 122.25 W 122.2 W
10 m/s
b) Latitude (°)
Longitude (°)
37.00 N
36.98 N
36.96 N
36.94 N
36.92 N
36.9 N
36.88 N
36.86 N
36.84 N
36.82 N
36.8 N
16.5
16
15.5
15
14.5
14
13.5
13
12.5
12
11.5
Fig. 19.1a,b From [19.2]. Three gliders moving northwest in triangular formation (gray lines) from 18:00 GMT August
6 into late morning August 7, 2003. Colored dots indicate the temperature in degree Celsius (see color scale) at (a) 5 m
depth and (b) 30 m depth. Black circles and lines show initial position and formation, and open circles with a cross inside
triangles illustrate the path of the center of the triangle formation. Red arrows correspond to estimate of the negative
gradient of temperature in the horizontal plane along the path of the center of the triangular formation. The color contours
indicate sea-surface temperature in degree Celsius (see color scale) as sampled by the Naval postgraduate school’s TWIN
OTTER aircraft
on its own heading (measured on-board) and a deduced
reckoning estimate of its own position [19.91]. The deduced reckoning position is computed by integrating
an estimate of horizontal speed using the most recent
GPS fix as the initial condition. The horizontal speed
is estimated from depth and vertical speed, which are
estimated from on-board pressure measurements. The
method also uses the glider’s estimate of average flow,
computed from the difference on the surface between
its GPS and its deduced reckoned position.
The first sea trial in which three Slocum gliders
coordinated their motion in an equilateral triangle formation was run over a period of 16 h on August 6–7,
2003, with asynchronous 2-hourly surfacings. The distance between gliders was prescribed to be 3 km and the
formation prescribed to move along a linear path heading northwest to measure the incipient upwelling front.
In the first half of the sea trial, there was no prescription
on the orientation of the formation so that it could most
efficiently maintain array resolution and follow its path.
In the second half of the sea trial, to test the orientation control feature of the methodology, the orientation
was prescribed such that one edge of the triangle would
always be normal to the path of the center of mass of
the group. The stable tracking of prescribed glider array
resolution and linear path made it possible for in-situ
estimates of gradients to be computed in near real time
from the gliders’ scalar measurements. The results suggest that the gliders could successfully be programmed
to autonomously follow their estimate of the gradient if
so desired.
Figure 19.1 shows a sequence of snapshots of
the triangular glider formation over the August 6–7,
2003 sea trial. Temperature measurements are shown
on 19.1a at 10 m depth and on 19.1b at 30 m depth. As
shown, the three vehicles stayed in formation moving
along the desired linear path despite relatively highspeed currents. The red arrows on the plot show a few
example glider estimates of the negative gradient of
temperature. These vectors point in the direction of the
cold water, as verified from independent temperature
measurements. The resolution corresponding to 3 km
between gliders led to remarkably smooth gradient estimates over time.
Three gliders again coordinated their motion in
an equilateral triangle formation in a second sea trial
on August 16–17, 2003. This time the distance between
gliders was prescribed to start at 6 km and then contract
to 3 km. This was meant to demonstrate the expansion
and contraction feature of the methodology and test the
effect of the different glider array resolutions on the gradient estimates. The formation was prescribed to move
along a zigzag path heading southwest across the upwelling front. Despite facing currents with magnitude
as high as the Slocum’s effective speed of 35 cm s
1 ,
the glider formation moved and contracted remarkably
well. The results suggest that the gliders could successfully be programmed to autonomously adapt their