

Autonomous Underwater Gliders 12.4 Optimal Size and Shape for Horizontal Transport Efficiency 311
Part B | 12.4
10
10
7
10
6
10
5
Profiling gliders
10
4
10
3
10
2
Maximum wing section lift-to-drag ratio C L /C D
Reynolds number R e = Uc
–
/v
10
3
10
2
10
1
1 NACA 641–612
2 NACA 632–415
3 FX 67–VG–136
4 FX 67–K–150
5 FX 05–H–126
6 FX 63–137
7 Liebeck 1969 (laminar)
8 FX 72–MS–150 A
9 NACA 23012 (rough)
10 NACA 23012 (smooth)
11 N–60 (smooth)
12 Gö 625 (smooth)
13 Zü 11
14 Liebeck 1969 (turb.)
15 NACA 633–618
16 Gö 795
17 Gö 796
18 Gö 798
19 Liebeck 1973 (laminar)
20 Liebeck 1973 (laminar)
21 Liebeck 1973 (laminar)
21
20
19
7 1
2
14
9
4
3
5
6
13
16
Schmitz
flat plate
17
18
Vogel
Drosophila
Locust
Thom and Swart
11
12
Gö 417a
10
15
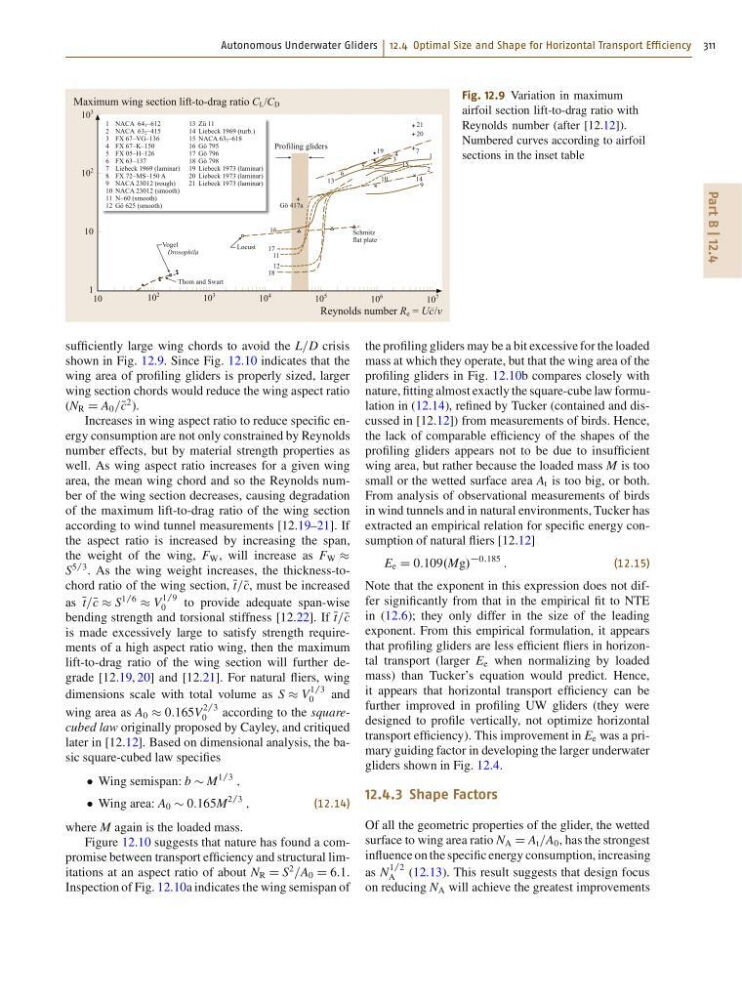
Fig. 12.9 Variation in maximum
airfoil section lift-to-drag ratio with
Reynolds number (after [12.12]).
Numbered curves according to airfoil
sections in the inset table
sufficiently large wing chords to avoid the L=D crisis
shown in Fig. 12.9. Since Fig. 12.10 indicates that the
wing area of profiling gliders is properly sized, larger
wing section chords would reduce the wing aspect ratio
(N R D A 0 =N c
2 ).
Increases in wing aspect ratio to reduce specific energy consumption are not only constrained by Reynolds
number effects, but by material strength properties as
well. As wing aspect ratio increases for a given wing
area, the mean wing chord and so the Reynolds number of the wing section decreases, causing degradation
of the maximum lift-to-drag ratio of the wing section
according to wind tunnel measurements [12.19–21]. If
the aspect ratio is increased by increasing the span,
the weight of the wing, F W , will increase as F W
S
5=3 . As the wing weight increases, the thickness-tochord ratio of the wing section, N t=N c, must be increased
as N t=N c S
1=6
V
1=9
0
to provide adequate span-wise
bending strength and torsional stiffness [12.22]. If N t=N c
is made excessively large to satisfy strength requirements of a high aspect ratio wing, then the maximum
lift-to-drag ratio of the wing section will further degrade [12.19, 20] and [12.21]. For natural fliers, wing
dimensions scale with total volume as S V
1=3
0
and
wing area as A 0 0:165V
2=3
0
according to the squarecubed law originally proposed by Cayley, and critiqued
later in [12.12]. Based on dimensional analysis, the basic square-cubed law specifies
Wing semispan: b M
1=3
;
Wing area: A 0 0:165M
2=3
;
(12.14)
where M again is the loaded mass.
Figure 12.10 suggests that nature has found a compromise between transport efficiency and structural limitations at an aspect ratio of about N R D S
2
=A 0 D 6:1.
Inspection of Fig. 12.10a indicates the wing semispan of
the profiling gliders may be a bit excessive for the loaded
mass at which they operate, but that the wing area of the
profiling gliders in Fig. 12.10b compares closely with
nature, fitting almost exactly the square-cube law formulation in (12.14), refined by Tucker (contained and discussed in [12.12]) from measurements of birds. Hence,
the lack of comparable efficiency of the shapes of the
profiling gliders appears not to be due to insufficient
wing area, but rather because the loaded mass M is too
small or the wetted surface area A t is too big, or both.
From analysis of observational measurements of birds
in wind tunnels and in natural environments, Tucker has
extracted an empirical relation for specific energy consumption of natural fliers [12.12]
E e D 0:109.Mg/
0:185
:
(12.15)
Note that the exponent in this expression does not differ significantly from that in the empirical fit to NTE
in (12.6); they only differ in the size of the leading
exponent. From this empirical formulation, it appears
that profiling gliders are less efficient fliers in horizontal transport (larger E e when normalizing by loaded
mass) than Tucker’s equation would predict. Hence,
it appears that horizontal transport efficiency can be
further improved in profiling UW gliders (they were
designed to profile vertically, not optimize horizontal
transport efficiency). This improvement in E e was a primary guiding factor in developing the larger underwater
gliders shown in Fig. 12.4.
12.4.3 Shape Factors
Of all the geometric properties of the glider, the wetted
surface to wing area ratio N A D A t =A 0 , has the strongest
influence on the specific energy consumption, increasing
as N
1=2
A
(12.13). This result suggests that design focus
on reducing N A will achieve the greatest improvements
Part B | 12.4
10
10
7
10
6
10
5
Profiling gliders
10
4
10
3
10
2
Maximum wing section lift-to-drag ratio C L /C D
Reynolds number R e = Uc
–
/v
10
3
10
2
10
1
1 NACA 641–612
2 NACA 632–415
3 FX 67–VG–136
4 FX 67–K–150
5 FX 05–H–126
6 FX 63–137
7 Liebeck 1969 (laminar)
8 FX 72–MS–150 A
9 NACA 23012 (rough)
10 NACA 23012 (smooth)
11 N–60 (smooth)
12 Gö 625 (smooth)
13 Zü 11
14 Liebeck 1969 (turb.)
15 NACA 633–618
16 Gö 795
17 Gö 796
18 Gö 798
19 Liebeck 1973 (laminar)
20 Liebeck 1973 (laminar)
21 Liebeck 1973 (laminar)
21
20
19
7 1
2
14
9
4
3
5
6
13
16
Schmitz
flat plate
17
18
Vogel
Drosophila
Locust
Thom and Swart
11
12
Gö 417a
10
15
Fig. 12.9 Variation in maximum
airfoil section lift-to-drag ratio with
Reynolds number (after [12.12]).
Numbered curves according to airfoil
sections in the inset table
sufficiently large wing chords to avoid the L=D crisis
shown in Fig. 12.9. Since Fig. 12.10 indicates that the
wing area of profiling gliders is properly sized, larger
wing section chords would reduce the wing aspect ratio
(N R D A 0 =N c
2 ).
Increases in wing aspect ratio to reduce specific energy consumption are not only constrained by Reynolds
number effects, but by material strength properties as
well. As wing aspect ratio increases for a given wing
area, the mean wing chord and so the Reynolds number of the wing section decreases, causing degradation
of the maximum lift-to-drag ratio of the wing section
according to wind tunnel measurements [12.19–21]. If
the aspect ratio is increased by increasing the span,
the weight of the wing, F W , will increase as F W
S
5=3 . As the wing weight increases, the thickness-tochord ratio of the wing section, N t=N c, must be increased
as N t=N c S
1=6
V
1=9
0
to provide adequate span-wise
bending strength and torsional stiffness [12.22]. If N t=N c
is made excessively large to satisfy strength requirements of a high aspect ratio wing, then the maximum
lift-to-drag ratio of the wing section will further degrade [12.19, 20] and [12.21]. For natural fliers, wing
dimensions scale with total volume as S V
1=3
0
and
wing area as A 0 0:165V
2=3
0
according to the squarecubed law originally proposed by Cayley, and critiqued
later in [12.12]. Based on dimensional analysis, the basic square-cubed law specifies
Wing semispan: b M
1=3
;
Wing area: A 0 0:165M
2=3
;
(12.14)
where M again is the loaded mass.
Figure 12.10 suggests that nature has found a compromise between transport efficiency and structural limitations at an aspect ratio of about N R D S
2
=A 0 D 6:1.
Inspection of Fig. 12.10a indicates the wing semispan of
the profiling gliders may be a bit excessive for the loaded
mass at which they operate, but that the wing area of the
profiling gliders in Fig. 12.10b compares closely with
nature, fitting almost exactly the square-cube law formulation in (12.14), refined by Tucker (contained and discussed in [12.12]) from measurements of birds. Hence,
the lack of comparable efficiency of the shapes of the
profiling gliders appears not to be due to insufficient
wing area, but rather because the loaded mass M is too
small or the wetted surface area A t is too big, or both.
From analysis of observational measurements of birds
in wind tunnels and in natural environments, Tucker has
extracted an empirical relation for specific energy consumption of natural fliers [12.12]
E e D 0:109.Mg/
0:185
:
(12.15)
Note that the exponent in this expression does not differ significantly from that in the empirical fit to NTE
in (12.6); they only differ in the size of the leading
exponent. From this empirical formulation, it appears
that profiling gliders are less efficient fliers in horizontal transport (larger E e when normalizing by loaded
mass) than Tucker’s equation would predict. Hence,
it appears that horizontal transport efficiency can be
further improved in profiling UW gliders (they were
designed to profile vertically, not optimize horizontal
transport efficiency). This improvement in E e was a primary guiding factor in developing the larger underwater
gliders shown in Fig. 12.4.
12.4.3 Shape Factors
Of all the geometric properties of the glider, the wetted
surface to wing area ratio N A D A t =A 0 , has the strongest
influence on the specific energy consumption, increasing
as N
1=2
A
(12.13). This result suggests that design focus
on reducing N A will achieve the greatest improvements