

Autonomous Underwater Gliders 12.4 Optimal Size and Shape for Horizontal Transport Efficiency 309
Part B | 12.4
contribute to this apparent disparity in efficiency. First,
the profiling gliders were not designed for efficiency
in horizontal transport, but rather to move primarily
up and down to collect vertical profiles of water column properties. For this case, then, a more useful form
for (12.5) is to normalize by U, the speed along the glide
slope, rather than the horizontal speed u. This change
results in the net transport economy values from (12.5)
being multiplied by u=U D cos.. /, where is the glide
angle from the horizontal (Fig. 12.1). Since the profiling gliders are flown at glide angles of 20
ı to 30
ı , this
factor results in only a 10% reduction in NTE. Second,
rather than normalize the energy consumed per distance
traveled by the weight of the loaded mass, NTE can be
defined by normalizing by the dry bulk weight. Whereas
this change in normalization usually has little effect on
NTE for fliers in air (dry bulk weight usually is equal to
the weight of the loaded mass), it causes a significant
decrease in NTE for underwater platforms since the
weight of the loaded mass can be remarkably different
than the dry bulk weight due to the positive buoyancy
of displaced water. Profiling gliders may be intrinsically less efficient relative to birds because of the extra
energy that is consumed when gliding through ocean
stratification, particularly when crossing the thermocline. Density changes in the ocean water mass cause
corresponding changes in net buoyancy B, resulting in
additional rate of working by gravity as defined by the
right hand side of (12.1). A comparison of NTE for
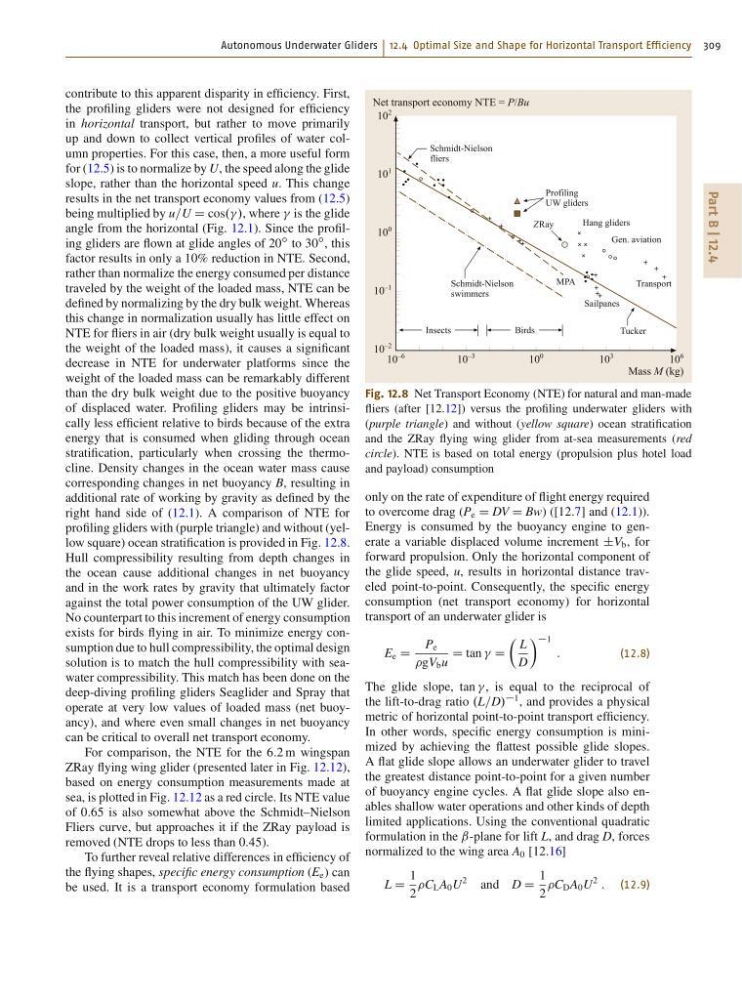
profiling gliders with (purple triangle) and without (yellow square) ocean stratification is provided in Fig. 12.8.
Hull compressibility resulting from depth changes in
the ocean cause additional changes in net buoyancy
and in the work rates by gravity that ultimately factor
against the total power consumption of the UW glider.
No counterpart to this increment of energy consumption
exists for birds flying in air. To minimize energy consumption due to hull compressibility, the optimal design
solution is to match the hull compressibility with seawater compressibility. This match has been done on the
deep-diving profiling gliders Seaglider and Spray that
operate at very low values of loaded mass (net buoyancy), and where even small changes in net buoyancy
can be critical to overall net transport economy.
For comparison, the NTE for the 6:2 m wingspan
ZRay flying wing glider (presented later in Fig. 12.12),
based on energy consumption measurements made at
sea, is plotted in Fig. 12.12 as a red circle. Its NTE value
of 0:65 is also somewhat above the Schmidt–Nielson
Fliers curve, but approaches it if the ZRay payload is
removed (NTE drops to less than 0:45).
To further reveal relative differences in efficiency of
the flying shapes, specific energy consumption (E e ) can
be used. It is a transport economy formulation based
10
–6
10
–3
Schmidt-Nielson
fliers
Schmidt-Nielson
swimmers
Profiling
UW gliders
ZRay
Insects
Birds
Sailpanes
MPA
Hang gliders
Gen. aviation
Tucker
Transport
10
0
10
3
10
6
Net transport economy NTE = P/Bu
Mass M (kg)
10
2
10
1
10
0
10
–1
10
–2
Fig. 12.8 Net Transport Economy (NTE) for natural and man-made
fliers (after [12.12]) versus the profiling underwater gliders with
(purple triangle) and without (yellow square) ocean stratification
and the ZRay flying wing glider from at-sea measurements (red
circle). NTE is based on total energy (propulsion plus hotel load
and payload) consumption
only on the rate of expenditure of flight energy required
to overcome drag (P e D DV D Bw) ([12.7] and (12.1)).
Energy is consumed by the buoyancy engine to generate a variable displaced volume increment ˙V b , for
forward propulsion. Only the horizontal component of
the glide speed, u, results in horizontal distance traveled point-to-point. Consequently, the specific energy
consumption (net transport economy) for horizontal
transport of an underwater glider is
E e D
P e
gV b u
D tan D
Â
L
D
à 1
:
(12.8)
The glide slope, tan , is equal to the reciprocal of
the lift-to-drag ratio .L=D/
1 , and provides a physical
metric of horizontal point-to-point transport efficiency.
In other words, specific energy consumption is minimized by achieving the flattest possible glide slopes.
A flat glide slope allows an underwater glider to travel
the greatest distance point-to-point for a given number
of buoyancy engine cycles. A flat glide slope also enables shallow water operations and other kinds of depth
limited applications. Using the conventional quadratic
formulation in the ˇ-plane for lift L, and drag D, forces
normalized to the wing area A 0 [12.16]
L D
1
2
C L A 0 U
2
and D D
1
2
C D A 0 U
2
: (12.9)
Part B | 12.4
contribute to this apparent disparity in efficiency. First,
the profiling gliders were not designed for efficiency
in horizontal transport, but rather to move primarily
up and down to collect vertical profiles of water column properties. For this case, then, a more useful form
for (12.5) is to normalize by U, the speed along the glide
slope, rather than the horizontal speed u. This change
results in the net transport economy values from (12.5)
being multiplied by u=U D cos.. /, where is the glide
angle from the horizontal (Fig. 12.1). Since the profiling gliders are flown at glide angles of 20
ı to 30
ı , this
factor results in only a 10% reduction in NTE. Second,
rather than normalize the energy consumed per distance
traveled by the weight of the loaded mass, NTE can be
defined by normalizing by the dry bulk weight. Whereas
this change in normalization usually has little effect on
NTE for fliers in air (dry bulk weight usually is equal to
the weight of the loaded mass), it causes a significant
decrease in NTE for underwater platforms since the
weight of the loaded mass can be remarkably different
than the dry bulk weight due to the positive buoyancy
of displaced water. Profiling gliders may be intrinsically less efficient relative to birds because of the extra
energy that is consumed when gliding through ocean
stratification, particularly when crossing the thermocline. Density changes in the ocean water mass cause
corresponding changes in net buoyancy B, resulting in
additional rate of working by gravity as defined by the
right hand side of (12.1). A comparison of NTE for
profiling gliders with (purple triangle) and without (yellow square) ocean stratification is provided in Fig. 12.8.
Hull compressibility resulting from depth changes in
the ocean cause additional changes in net buoyancy
and in the work rates by gravity that ultimately factor
against the total power consumption of the UW glider.
No counterpart to this increment of energy consumption
exists for birds flying in air. To minimize energy consumption due to hull compressibility, the optimal design
solution is to match the hull compressibility with seawater compressibility. This match has been done on the
deep-diving profiling gliders Seaglider and Spray that
operate at very low values of loaded mass (net buoyancy), and where even small changes in net buoyancy
can be critical to overall net transport economy.
For comparison, the NTE for the 6:2 m wingspan
ZRay flying wing glider (presented later in Fig. 12.12),
based on energy consumption measurements made at
sea, is plotted in Fig. 12.12 as a red circle. Its NTE value
of 0:65 is also somewhat above the Schmidt–Nielson
Fliers curve, but approaches it if the ZRay payload is
removed (NTE drops to less than 0:45).
To further reveal relative differences in efficiency of
the flying shapes, specific energy consumption (E e ) can
be used. It is a transport economy formulation based
10
–6
10
–3
Schmidt-Nielson
fliers
Schmidt-Nielson
swimmers
Profiling
UW gliders
ZRay
Insects
Birds
Sailpanes
MPA
Hang gliders
Gen. aviation
Tucker
Transport
10
0
10
3
10
6
Net transport economy NTE = P/Bu
Mass M (kg)
10
2
10
1
10
0
10
–1
10
–2
Fig. 12.8 Net Transport Economy (NTE) for natural and man-made
fliers (after [12.12]) versus the profiling underwater gliders with
(purple triangle) and without (yellow square) ocean stratification
and the ZRay flying wing glider from at-sea measurements (red
circle). NTE is based on total energy (propulsion plus hotel load
and payload) consumption
only on the rate of expenditure of flight energy required
to overcome drag (P e D DV D Bw) ([12.7] and (12.1)).
Energy is consumed by the buoyancy engine to generate a variable displaced volume increment ˙V b , for
forward propulsion. Only the horizontal component of
the glide speed, u, results in horizontal distance traveled point-to-point. Consequently, the specific energy
consumption (net transport economy) for horizontal
transport of an underwater glider is
E e D
P e
gV b u
D tan D
Â
L
D
à 1
:
(12.8)
The glide slope, tan , is equal to the reciprocal of
the lift-to-drag ratio .L=D/
1 , and provides a physical
metric of horizontal point-to-point transport efficiency.
In other words, specific energy consumption is minimized by achieving the flattest possible glide slopes.
A flat glide slope allows an underwater glider to travel
the greatest distance point-to-point for a given number
of buoyancy engine cycles. A flat glide slope also enables shallow water operations and other kinds of depth
limited applications. Using the conventional quadratic
formulation in the ˇ-plane for lift L, and drag D, forces
normalized to the wing area A 0 [12.16]
L D
1
2
C L A 0 U
2
and D D
1
2
C D A 0 U
2
: (12.9)