

56
Multiscale Hydrologic Remote Sensing: Perspectives and Applications
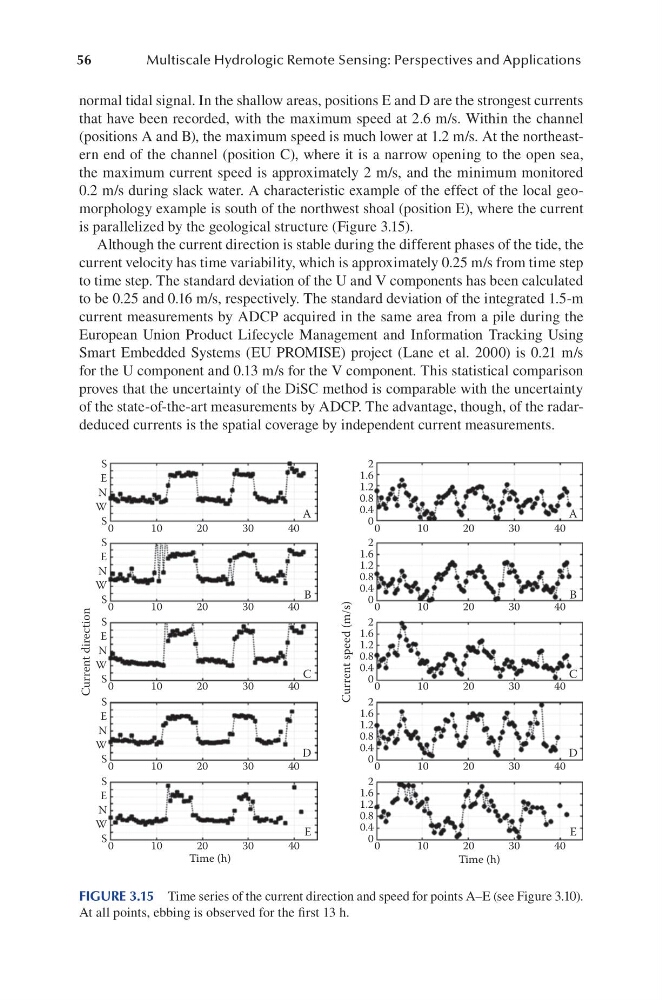
normal tidal signal. In the shallow areas, positions E and D are the strongest currents
that have been recorded, with the maximum speed at 2.6 m/s. Within the channel
(positions A and B), the maximum speed is much lower at 1.2 m/s. At the northeastern end of the channel (position C), where it is a narrow opening to the open sea,
the maximum current speed is approximately 2 m/s, and the minimum monitored
0.2 m/s during slack water. A characteristic example of the effect of the local geomorphology example is south of the northwest shoal (position E), where the current
is parallelized by the geological structure (Figure 3.15).
Although the current direction is stable during the different phases of the tide, the
current velocity has time variability, which is approximately 0.25 m/s from time step
to time step. The standard deviation of the U and V components has been calculated
to be 0.25 and 0.16 m/s, respectively. The standard deviation of the integrated 1.5-m
current measurements by ADCP acquired in the same area from a pile during the
European Union Product Lifecycle Management and Information Tracking Using
Smart Embedded Systems (EU PROMISE) project (Lane et al. 2000) is 0.21 m/s
for the U component and 0.13 m/s for the V component. This statistical comparison
proves that the uncertainty of the DiSC method is comparable with the uncertainty
of the state-of-the-art measurements by ADCP. The advantage, though, of the radardeduced currents is the spatial coverage by independent current measurements.
S
E
N
W
S 0
10
20
30
40
2
1.6
1.2
0.8
0.4
0 0
Current direction
Current speed (m/s)
10
20
30
40
S
E
N
W
S 0
10
20
30
40
2
1.6
1.2
0.8
0.4
0 0
10
20
30
40
S
E
N
W
S 0
10
20
30
40
2
1.6
1.2
0.8
0.4
0 0
10
20
30
40
S
E
N
W
S 0
10
20
30
40
2
1.6
1.2
0.8
0.4
0 0
10
20
30
40
S
E
N
W
S 0
10
20
30
40
2
1.6
1.2
0.8
0.4
0 0
10
20
30
40
A
B
C
D
E
A
B
C
D
E
Time (h)
Time (h)
FIGURE 3.15 Time series of the current direction and speed for points A–E (see Figure 3.10).
At all points, ebbing is observed for the first 13 h.
Multiscale Hydrologic Remote Sensing: Perspectives and Applications
normal tidal signal. In the shallow areas, positions E and D are the strongest currents
that have been recorded, with the maximum speed at 2.6 m/s. Within the channel
(positions A and B), the maximum speed is much lower at 1.2 m/s. At the northeastern end of the channel (position C), where it is a narrow opening to the open sea,
the maximum current speed is approximately 2 m/s, and the minimum monitored
0.2 m/s during slack water. A characteristic example of the effect of the local geomorphology example is south of the northwest shoal (position E), where the current
is parallelized by the geological structure (Figure 3.15).
Although the current direction is stable during the different phases of the tide, the
current velocity has time variability, which is approximately 0.25 m/s from time step
to time step. The standard deviation of the U and V components has been calculated
to be 0.25 and 0.16 m/s, respectively. The standard deviation of the integrated 1.5-m
current measurements by ADCP acquired in the same area from a pile during the
European Union Product Lifecycle Management and Information Tracking Using
Smart Embedded Systems (EU PROMISE) project (Lane et al. 2000) is 0.21 m/s
for the U component and 0.13 m/s for the V component. This statistical comparison
proves that the uncertainty of the DiSC method is comparable with the uncertainty
of the state-of-the-art measurements by ADCP. The advantage, though, of the radardeduced currents is the spatial coverage by independent current measurements.
S
E
N
W
S 0
10
20
30
40
2
1.6
1.2
0.8
0.4
0 0
Current direction
Current speed (m/s)
10
20
30
40
S
E
N
W
S 0
10
20
30
40
2
1.6
1.2
0.8
0.4
0 0
10
20
30
40
S
E
N
W
S 0
10
20
30
40
2
1.6
1.2
0.8
0.4
0 0
10
20
30
40
S
E
N
W
S 0
10
20
30
40
2
1.6
1.2
0.8
0.4
0 0
10
20
30
40
S
E
N
W
S 0
10
20
30
40
2
1.6
1.2
0.8
0.4
0 0
10
20
30
40
A
B
C
D
E
A
B
C
D
E
Time (h)
Time (h)
FIGURE 3.15 Time series of the current direction and speed for points A–E (see Figure 3.10).
At all points, ebbing is observed for the first 13 h.