

54
Multiscale Hydrologic Remote Sensing: Perspectives and Applications
could be explained. The maximum speed depends on the position of the measurement and varies between 1.2 and 2.5 m/s; the minimum velocity was recorded in
the channel at 0.2 m/s. The current direction is northwesterly, with small deviations
(Figure 3.13); as it is expected, the maximum of the standard deviation of the velocity is higher at areas where there are missing values, approximately, 70°, but still, the
main current direction is constant and steered by the local geomorphology. In the
channel, the standard deviation of the direction is as low as 35°.
Afterward, with the stabilization of the air pressure, the normal behavior of the
tide is restored; the tidal period is approximately 13 h. The ebbing lasts approximately 6 h, and the flooding at 6.5 h, which is confirmed by calculating the autocorrelation of the current field (Figure 3.14) time series after the trespassing of the
low-pressure front shown in Figure 3.10. Despite their short length, there is a clear
signal of the tidal period.
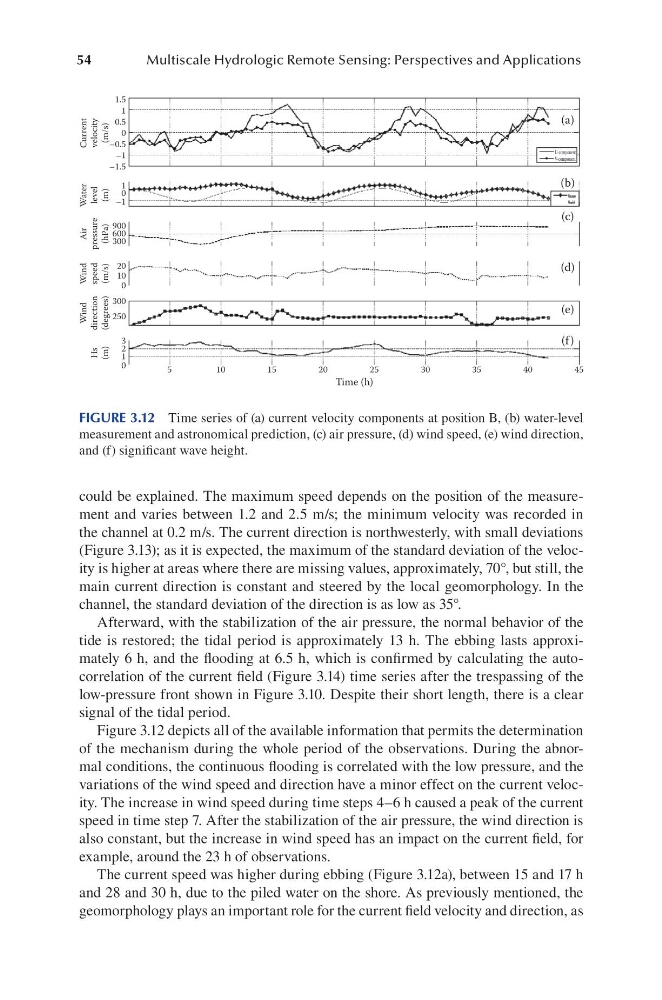
Figure 3.12 depicts all of the available information that permits the determination
of the mechanism during the whole period of the observations. During the abnormal conditions, the continuous flooding is correlated with the low pressure, and the
variations of the wind speed and direction have a minor effect on the current velocity. The increase in wind speed during time steps 4–6 h caused a peak of the current
speed in time step 7. After the stabilization of the air pressure, the wind direction is
also constant, but the increase in wind speed has an impact on the current field, for
example, around the 23 h of observations.
The current speed was higher during ebbing (Figure 3.12a), between 15 and 17 h
and 28 and 30 h, due to the piled water on the shore. As previously mentioned, the
geomorphology plays an important role for the current field velocity and direction, as
1.5
1
0.5
–0.5
–1
–1
900
600
300
20
10
0
300
250
3
2
1
0
5
10
15
20
25
Time (h)
Current
velocity
(m/s)
Water
level
(m)
Wind
speed
(m/s)
Wind
direction
(degrees)
Hs
(m)
Air
pressure
(hPa)
30
35
40
45
–1.5
0
0
1
(a)
(b)
(c)
(d)
(e)
(f )
U-component
V-component
FIGURE 3.12 Time series of (a) current velocity components at position B, (b) water-level
measurement and astronomical prediction, (c) air pressure, (d) wind speed, (e) wind direction,
and (f) significant wave height.
Multiscale Hydrologic Remote Sensing: Perspectives and Applications
could be explained. The maximum speed depends on the position of the measurement and varies between 1.2 and 2.5 m/s; the minimum velocity was recorded in
the channel at 0.2 m/s. The current direction is northwesterly, with small deviations
(Figure 3.13); as it is expected, the maximum of the standard deviation of the velocity is higher at areas where there are missing values, approximately, 70°, but still, the
main current direction is constant and steered by the local geomorphology. In the
channel, the standard deviation of the direction is as low as 35°.
Afterward, with the stabilization of the air pressure, the normal behavior of the
tide is restored; the tidal period is approximately 13 h. The ebbing lasts approximately 6 h, and the flooding at 6.5 h, which is confirmed by calculating the autocorrelation of the current field (Figure 3.14) time series after the trespassing of the
low-pressure front shown in Figure 3.10. Despite their short length, there is a clear
signal of the tidal period.
Figure 3.12 depicts all of the available information that permits the determination
of the mechanism during the whole period of the observations. During the abnormal conditions, the continuous flooding is correlated with the low pressure, and the
variations of the wind speed and direction have a minor effect on the current velocity. The increase in wind speed during time steps 4–6 h caused a peak of the current
speed in time step 7. After the stabilization of the air pressure, the wind direction is
also constant, but the increase in wind speed has an impact on the current field, for
example, around the 23 h of observations.
The current speed was higher during ebbing (Figure 3.12a), between 15 and 17 h
and 28 and 30 h, due to the piled water on the shore. As previously mentioned, the
geomorphology plays an important role for the current field velocity and direction, as
1.5
1
0.5
–0.5
–1
–1
900
600
300
20
10
0
300
250
3
2
1
0
5
10
15
20
25
Time (h)
Current
velocity
(m/s)
Water
level
(m)
Wind
speed
(m/s)
Wind
direction
(degrees)
Hs
(m)
Air
pressure
(hPa)
30
35
40
45
–1.5
0
0
1
(a)
(b)
(c)
(d)
(e)
(f )
U-component
V-component
FIGURE 3.12 Time series of (a) current velocity components at position B, (b) water-level
measurement and astronomical prediction, (c) air pressure, (d) wind speed, (e) wind direction,
and (f) significant wave height.