

38
Multiscale Hydrologic Remote Sensing: Perspectives and Applications
of the surveyed area was mapped by coupling the multibeam survey technique with
high-accuracy positioning systems. EM 3000 is designed to be operated in coastal
areas (operation depth of 3–200 m and operation frequency of 300 kHz, with a
ping repetition rate of 15 Hz). The three-dimensional (3-D) sonar head positions
and orientations were determined by combining antenna position, gyro-compass,
and motion sensor data. The exactness of ship position accuracy is on the order of
centimeters. The multibeam echosounder measurements were further processed by
a digital terrain model with the “Seabed” algorithm (Anonymous 2003). The grid
size of the final output is 2 m × 2 m, and the value of each grid cell is determined by
averaging more than 25 data points. The multibeam echosounder’s data for the DiSC
validation were acquired on 25 August 2003, 2 days before a storm. For comparison
with the DiSC results, the echo soundings have been averaged spatially in the radar
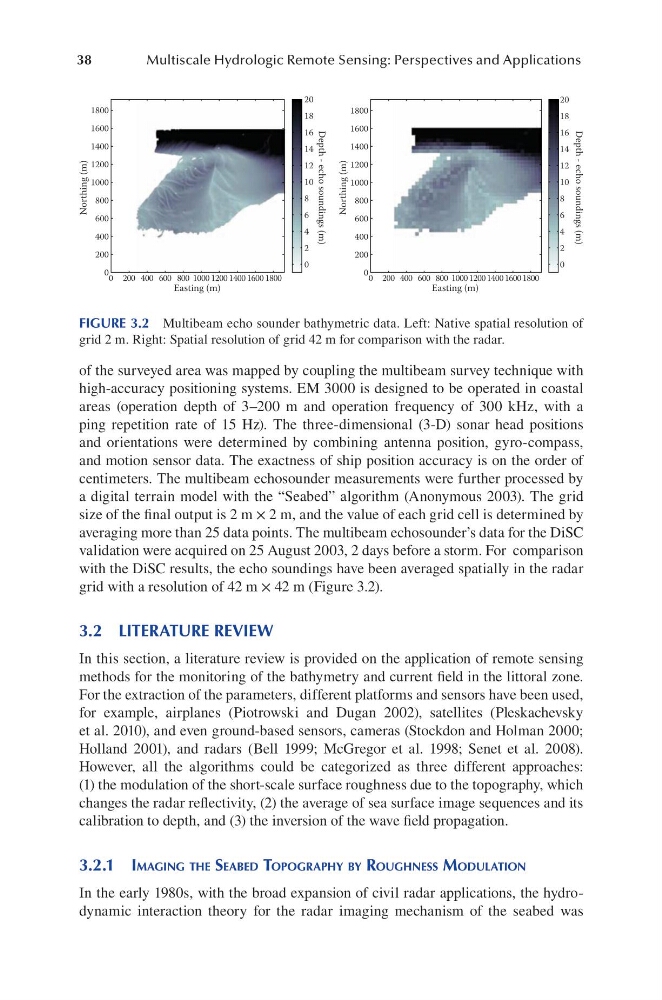
grid with a resolution of 42 m × 42 m (Figure 3.2).
3.2 LITERATURE REVIEW
In this section, a literature review is provided on the application of remote sensing
methods for the monitoring of the bathymetry and current field in the littoral zone.
For the extraction of the parameters, different platforms and sensors have been used,
for example, airplanes (Piotrowski and Dugan 2002), satellites (Pleskachevsky
et al. 2010), and even ground-based sensors, cameras (Stockdon and Holman 2000;
Holland 2001), and radars (Bell 1999; McGregor et al. 1998; Senet et al. 2008).
However, all the algorithms could be categorized as three different approaches:
(1) the modulation of the short-scale surface roughness due to the topography, which
changes the radar reflectivity, (2) the average of sea surface image sequences and its
calibration to depth, and (3) the inversion of the wave field propagation.
3.2.1 iMaging the SeaBed toPogRaPhy By RoughneSS Modulation
In the early 1980s, with the broad expansion of civil radar applications, the hydrodynamic interaction theory for the radar imaging mechanism of the seabed was
1800
20
18
16
14
12
10
8
6
4
2
0
1600
1400
1200
1000
800
600
400
200
0 0 200 400 600 800 1000
Easting (m)
Northing (m)
Depth - echo soundings (m)
1200 1400 1600 1800
1800
20
18
16
14
12
10
8
6
4
2
0
1600
1400
1200
1000
800
600
400
200
0 0 200 400 600 800 1000
Easting (m)
Northing (m)
Depth - echo soundings (m)
1200 1400 1600 1800
FIGURE 3.2 Multibeam echo sounder bathymetric data. Left: Native spatial resolution of
grid 2 m. Right: Spatial resolution of grid 42 m for comparison with the radar.
Multiscale Hydrologic Remote Sensing: Perspectives and Applications
of the surveyed area was mapped by coupling the multibeam survey technique with
high-accuracy positioning systems. EM 3000 is designed to be operated in coastal
areas (operation depth of 3–200 m and operation frequency of 300 kHz, with a
ping repetition rate of 15 Hz). The three-dimensional (3-D) sonar head positions
and orientations were determined by combining antenna position, gyro-compass,
and motion sensor data. The exactness of ship position accuracy is on the order of
centimeters. The multibeam echosounder measurements were further processed by
a digital terrain model with the “Seabed” algorithm (Anonymous 2003). The grid
size of the final output is 2 m × 2 m, and the value of each grid cell is determined by
averaging more than 25 data points. The multibeam echosounder’s data for the DiSC
validation were acquired on 25 August 2003, 2 days before a storm. For comparison
with the DiSC results, the echo soundings have been averaged spatially in the radar
grid with a resolution of 42 m × 42 m (Figure 3.2).
3.2 LITERATURE REVIEW
In this section, a literature review is provided on the application of remote sensing
methods for the monitoring of the bathymetry and current field in the littoral zone.
For the extraction of the parameters, different platforms and sensors have been used,
for example, airplanes (Piotrowski and Dugan 2002), satellites (Pleskachevsky
et al. 2010), and even ground-based sensors, cameras (Stockdon and Holman 2000;
Holland 2001), and radars (Bell 1999; McGregor et al. 1998; Senet et al. 2008).
However, all the algorithms could be categorized as three different approaches:
(1) the modulation of the short-scale surface roughness due to the topography, which
changes the radar reflectivity, (2) the average of sea surface image sequences and its
calibration to depth, and (3) the inversion of the wave field propagation.
3.2.1 iMaging the SeaBed toPogRaPhy By RoughneSS Modulation
In the early 1980s, with the broad expansion of civil radar applications, the hydrodynamic interaction theory for the radar imaging mechanism of the seabed was
1800
20
18
16
14
12
10
8
6
4
2
0
1600
1400
1200
1000
800
600
400
200
0 0 200 400 600 800 1000
Easting (m)
Northing (m)
Depth - echo soundings (m)
1200 1400 1600 1800
1800
20
18
16
14
12
10
8
6
4
2
0
1600
1400
1200
1000
800
600
400
200
0 0 200 400 600 800 1000
Easting (m)
Northing (m)
Depth - echo soundings (m)
1200 1400 1600 1800
FIGURE 3.2 Multibeam echo sounder bathymetric data. Left: Native spatial resolution of
grid 2 m. Right: Spatial resolution of grid 42 m for comparison with the radar.