

524
Multiscale Hydrologic Remote Sensing: Perspectives and Applications
geolocation data is applied to identify water pixels. MODIS active fire images with
a 250-m spatial resolution provided by the MODIS Rapid Response Team (http://
rapidfire.sci.gsfc.nasa.gov/) and the active fire mask are used to evaluate the performances of the NMDI for forest fire detection. Only Terra MODIS data are used in
this study, the given that 15 of the 20 detectors in Aqua MODIS band 6 are either
nonfunctional or noisy (Wang et al. 2006).
21.5.2 Methodology foR fiRe detection
By combining information from multiple NIR and SWIR channels, the NMDI has
proven to be a good indicator for both soil and vegetation drought. For bare soil or
sparsely vegetated areas, higher values of the NMDI indicate an increasing severity
of soil drought, while for heavily vegetated areas with LAI ≥ 2, lower NMDI values
indicate an increasing severity of vegetation drought (Wang and Qu 2007). Since
NMDI can monitor both vegetation and soil water content at the same time, it is
expected to provide accurate and valuable information about drought and fire conditions, considering that the bare soil in the area will become exposed if vegetation
burns.
Figure 21.12 describes the fl owchart of the application of the NMDI to moni21.12 describes the fl owchart of the application of the NMDI to moni.12 describes the flowchart of the application of the NMDI to monitor soil and vegetation drought. First, the land/sea mask obtained from the MODIS
L1A geolocation data and cloud mask derived on the basis of the method developed
by Giglio et al. (2003) are applied to identify water- and cloud-free pixels for the
study area. The vegetation index, the NDVI, derived from MODIS bands 1 and 2
is employed to separate bare soil and vegetation pixels, given that the NDVI is one
of the most extensively applied vegetation indices related to the LAI (Myneni et al.
1995). In general, higher NDVI values represent denser vegetations, and if the NDVI
value exceeds 0.4, the area is thought to be covered entirely by forest, greenery, or
other vegetation (Suzuki et al. 2001; Nihei et al. 2002). The fixed NDVI threshold of
0.4, instead of LAI value of 2, is employed to flag soil and vegetation pixels. A waterand cloud-free pixel will be mapped as vegetation if the NDVI is ≥0.4; otherwise, the
pixel will be classified as soil.
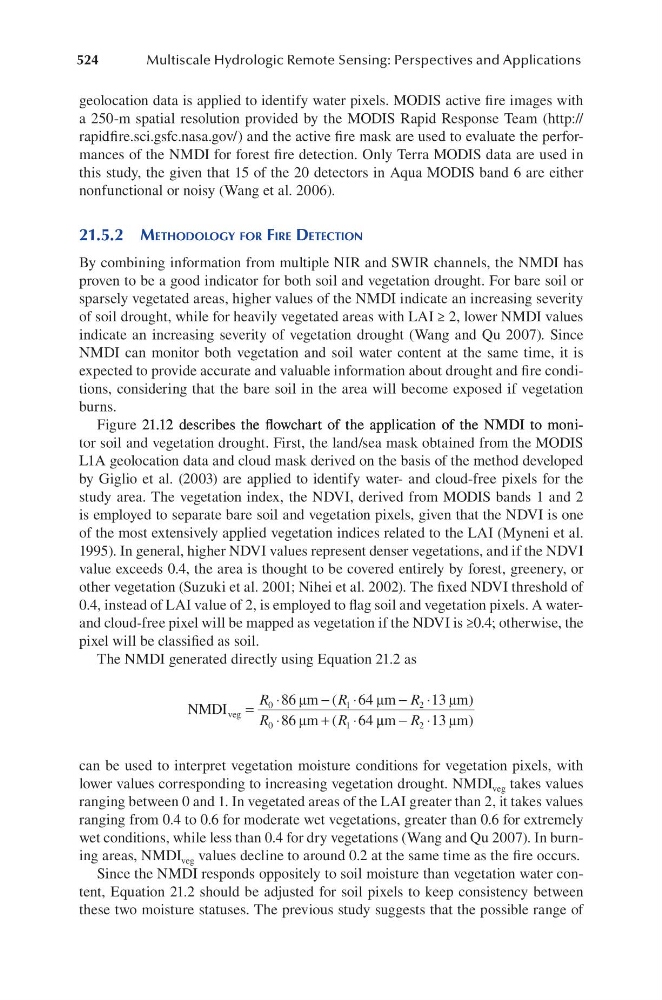
The NMDI generated directly using Equation 21.2 as
NMDI
m
m
m
m
veg =
⋅
−
⋅
− ⋅
⋅
+
⋅
R
R
R
R
R
0
1
2
0
1
86
64
13
86
64
µ
µ
µ
µ
(
)
(
µ µ
µ
m
m
− ⋅
R 2 13 )
can be used to interpret vegetation moisture conditions for vegetation pixels, with
lower values corresponding to increasing vegetation drought. NMDI veg takes values
ranging between 0 and 1. In vegetated areas of the LAI greater than 2, it takes values
ranging from 0.4 to 0.6 for moderate wet vegetations, greater than 0.6 for extremely
wet conditions, while less than 0.4 for dry vegetations (Wang and Qu 2007). In burning areas, NMDI veg values decline to around 0.2 at the same time as the fire occurs.
Since the NMDI responds oppositely to soil moisture than vegetation water content, Equation 21.2 should be adjusted for soil pixels to keep consistency between
these two moisture statuses. The previous study suggests that the possible range of
Multiscale Hydrologic Remote Sensing: Perspectives and Applications
geolocation data is applied to identify water pixels. MODIS active fire images with
a 250-m spatial resolution provided by the MODIS Rapid Response Team (http://
rapidfire.sci.gsfc.nasa.gov/) and the active fire mask are used to evaluate the performances of the NMDI for forest fire detection. Only Terra MODIS data are used in
this study, the given that 15 of the 20 detectors in Aqua MODIS band 6 are either
nonfunctional or noisy (Wang et al. 2006).
21.5.2 Methodology foR fiRe detection
By combining information from multiple NIR and SWIR channels, the NMDI has
proven to be a good indicator for both soil and vegetation drought. For bare soil or
sparsely vegetated areas, higher values of the NMDI indicate an increasing severity
of soil drought, while for heavily vegetated areas with LAI ≥ 2, lower NMDI values
indicate an increasing severity of vegetation drought (Wang and Qu 2007). Since
NMDI can monitor both vegetation and soil water content at the same time, it is
expected to provide accurate and valuable information about drought and fire conditions, considering that the bare soil in the area will become exposed if vegetation
burns.
Figure 21.12 describes the fl owchart of the application of the NMDI to moni21.12 describes the fl owchart of the application of the NMDI to moni.12 describes the flowchart of the application of the NMDI to monitor soil and vegetation drought. First, the land/sea mask obtained from the MODIS
L1A geolocation data and cloud mask derived on the basis of the method developed
by Giglio et al. (2003) are applied to identify water- and cloud-free pixels for the
study area. The vegetation index, the NDVI, derived from MODIS bands 1 and 2
is employed to separate bare soil and vegetation pixels, given that the NDVI is one
of the most extensively applied vegetation indices related to the LAI (Myneni et al.
1995). In general, higher NDVI values represent denser vegetations, and if the NDVI
value exceeds 0.4, the area is thought to be covered entirely by forest, greenery, or
other vegetation (Suzuki et al. 2001; Nihei et al. 2002). The fixed NDVI threshold of
0.4, instead of LAI value of 2, is employed to flag soil and vegetation pixels. A waterand cloud-free pixel will be mapped as vegetation if the NDVI is ≥0.4; otherwise, the
pixel will be classified as soil.
The NMDI generated directly using Equation 21.2 as
NMDI
m
m
m
m
veg =
⋅
−
⋅
− ⋅
⋅
+
⋅
R
R
R
R
R
0
1
2
0
1
86
64
13
86
64
µ
µ
µ
µ
(
)
(
µ µ
µ
m
m
− ⋅
R 2 13 )
can be used to interpret vegetation moisture conditions for vegetation pixels, with
lower values corresponding to increasing vegetation drought. NMDI veg takes values
ranging between 0 and 1. In vegetated areas of the LAI greater than 2, it takes values
ranging from 0.4 to 0.6 for moderate wet vegetations, greater than 0.6 for extremely
wet conditions, while less than 0.4 for dry vegetations (Wang and Qu 2007). In burning areas, NMDI veg values decline to around 0.2 at the same time as the fire occurs.
Since the NMDI responds oppositely to soil moisture than vegetation water content, Equation 21.2 should be adjusted for soil pixels to keep consistency between
these two moisture statuses. The previous study suggests that the possible range of