

512
Multiscale Hydrologic Remote Sensing: Perspectives and Applications
water index is NDWI, which has recently been used to detect and monitor the moisture
condition of vegetation canopies over large areas (Xiao et al. 2002; Jackson et al. 2004;
Maki et al. 2004; Chen et al. 2005; Delbart et al. 2005; Gu et al. 2007). Simple spectral
indices, similar to NDWI, always use two bands, including one sensitive band and one
insensitive band, to interpret changes in leaf water content. These simple indices were
suggested for traditional sensors that have only a few optical bands. With more optical
bands, the MODIS measurements might provide a good opportunity to estimate vegetation water content and soil moisture more accurately and robustly. We performed
sensitivity studies of three SWIR bands of MODIS and observed that the reflectance of
each SWIR band (Wang et al. 2008) illustrates that the reflectance of each SWIR band
responds differently to variations in soil and vegetation moisture. We therefore defined
the NMDI by combining multiple SWIR bands with a NIR band.
21.3.1 foRMation of nMdi
The following exponential model developed by Lobell and Asner (2002) was used to
simulate the soil reflectance variations due to moisture change:
R = f × R dry + (1 – f ) × R dry × exp(–c × θ),
(21.1)
where R is the soil reflectance at a particular wavelength, θ is the volumetric soil
water content, R dry is the reflectance of dry soil (at θ = 0.0), c describes the rate of
soil reflectance change with moisture, and f is the ratio of the saturated to dry reflectance. All variables, except for θ, are soil type and wavelength dependent. The soil
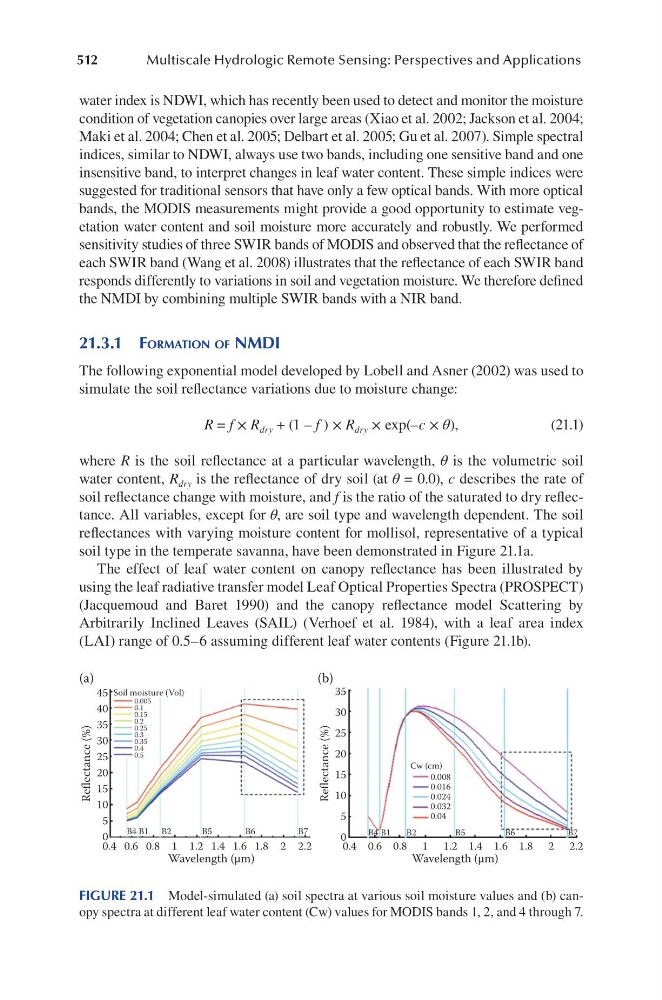
reflectances with varying moisture content for mollisol, representative of a typical
soil type in the temperate savanna, have been demonstrated in Figure 21.1a.
The effect of leaf water content on canopy reflectance has been illustrated by
using the leaf radiative transfer model Leaf Optical Properties Spectra (PROSPECT)
(Jacquemoud and Baret 1990) and the canopy reflectance model Scattering by
Arbitrarily Inclined Leaves (SAIL) (Verhoef et al. 1984), with a leaf area index
(LAI) range of 0.5–6 assuming different leaf water contents (Figure 21.1b).
(a)
(b)
45
40
35
30
25
20
15
10
5
0
35
30
25
20
15
10
5
0
Reflectance (%)
Reflectance (%)
0.4 0.6 0.8 1 1.2 1.4 1.6 1.8 2 2.2
Wavelength (µm)
0.4 0.6 0.8 1 1.2 1.4 1.6 1.8 2 2.2
Wavelength (µm)
Soil moisture (Vol)
Cw (cm)
0.005
0.1
0.15
0.2
0.25
0.3
0.35
0.4
0.5
0.008
0.016
0.024
0.032
0.04
B4 B1 B2
B5
B6
B7
B4 B1
B2
B5
B6
B7
FIGURE 21.1 Model-simulated (a) soil spectra at various soil moisture values and (b) canopy spectra at different leaf water content (Cw) values for MODIS bands 1, 2, and 4 through 7.
Multiscale Hydrologic Remote Sensing: Perspectives and Applications
water index is NDWI, which has recently been used to detect and monitor the moisture
condition of vegetation canopies over large areas (Xiao et al. 2002; Jackson et al. 2004;
Maki et al. 2004; Chen et al. 2005; Delbart et al. 2005; Gu et al. 2007). Simple spectral
indices, similar to NDWI, always use two bands, including one sensitive band and one
insensitive band, to interpret changes in leaf water content. These simple indices were
suggested for traditional sensors that have only a few optical bands. With more optical
bands, the MODIS measurements might provide a good opportunity to estimate vegetation water content and soil moisture more accurately and robustly. We performed
sensitivity studies of three SWIR bands of MODIS and observed that the reflectance of
each SWIR band (Wang et al. 2008) illustrates that the reflectance of each SWIR band
responds differently to variations in soil and vegetation moisture. We therefore defined
the NMDI by combining multiple SWIR bands with a NIR band.
21.3.1 foRMation of nMdi
The following exponential model developed by Lobell and Asner (2002) was used to
simulate the soil reflectance variations due to moisture change:
R = f × R dry + (1 – f ) × R dry × exp(–c × θ),
(21.1)
where R is the soil reflectance at a particular wavelength, θ is the volumetric soil
water content, R dry is the reflectance of dry soil (at θ = 0.0), c describes the rate of
soil reflectance change with moisture, and f is the ratio of the saturated to dry reflectance. All variables, except for θ, are soil type and wavelength dependent. The soil
reflectances with varying moisture content for mollisol, representative of a typical
soil type in the temperate savanna, have been demonstrated in Figure 21.1a.
The effect of leaf water content on canopy reflectance has been illustrated by
using the leaf radiative transfer model Leaf Optical Properties Spectra (PROSPECT)
(Jacquemoud and Baret 1990) and the canopy reflectance model Scattering by
Arbitrarily Inclined Leaves (SAIL) (Verhoef et al. 1984), with a leaf area index
(LAI) range of 0.5–6 assuming different leaf water contents (Figure 21.1b).
(a)
(b)
45
40
35
30
25
20
15
10
5
0
35
30
25
20
15
10
5
0
Reflectance (%)
Reflectance (%)
0.4 0.6 0.8 1 1.2 1.4 1.6 1.8 2 2.2
Wavelength (µm)
0.4 0.6 0.8 1 1.2 1.4 1.6 1.8 2 2.2
Wavelength (µm)
Soil moisture (Vol)
Cw (cm)
0.005
0.1
0.15
0.2
0.25
0.3
0.35
0.4
0.5
0.008
0.016
0.024
0.032
0.04
B4 B1 B2
B5
B6
B7
B4 B1
B2
B5
B6
B7
FIGURE 21.1 Model-simulated (a) soil spectra at various soil moisture values and (b) canopy spectra at different leaf water content (Cw) values for MODIS bands 1, 2, and 4 through 7.