

34
Multiscale Hydrologic Remote Sensing: Perspectives and Applications
3.1 INTRODUCTION
The dynamics of coastal zones with intensive sea–land interactions are complex, and
their interaction mechanisms are under continuous investigation. The coastal processes and their variability are driven by the interaction of waves, currents, winds,
and tides and their enormous forces that are applied on the bathymetry, causing massive changes in the coastal geomorphology by accreting or eroding the shoreline.
The sensing, monitoring, and modeling of such physical processes of coastal environments are crucial for the sustainable development of coastal regions and effective
management of the available land and water resources.
The acquisition of the appropriate data is essential but challenging, as the spatial
extent of the coastal phenomena varies from centimeters to kilometers, and the time
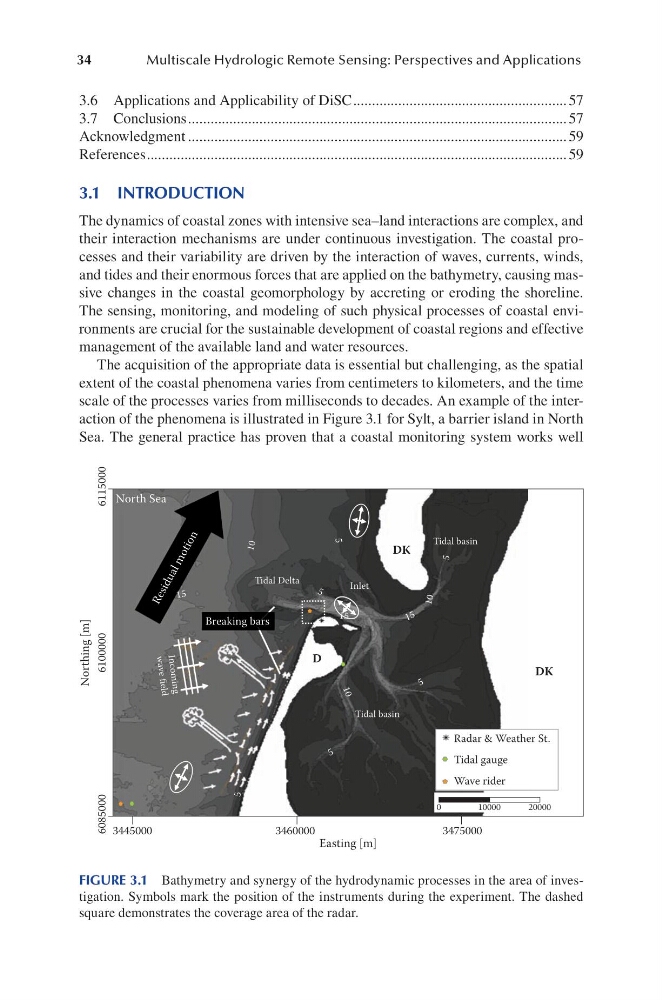
scale of the processes varies from milliseconds to decades. An example of the interaction of the phenomena is illustrated in Figure 3.1 for Sylt, a barrier island in North
Sea. The general practice has proven that a coastal monitoring system works well
3.6 Applications and Applicability of DiSC ......................................................... 57
3.7 Conclusions ..................................................................................................... 57
Acknowledgment ..................................................................................................... 59
References ................................................................................................................ 59
Tidal basin
Tidal Delta
Tidal basin
Inc
om
ing
wa
ve
fiel
d
Breaking bars
North Sea
R e s i d u a l m o t i o n
5
10
1 5
5
5
5
1
0
Inlet
15
15
5
5
10
DK
DK
D
Radar & Weather St.
Tidal gauge
Wave rider
0
10000
20000
3445000
6085000
6100000
Northing [m]
Easting [m]
6115000
3460000
3475000
FIGURE 3.1 Bathymetry and synergy of the hydrodynamic processes in the area of investigation. Symbols mark the position of the instruments during the experiment. The dashed
square demonstrates the coverage area of the radar.
Multiscale Hydrologic Remote Sensing: Perspectives and Applications
3.1 INTRODUCTION
The dynamics of coastal zones with intensive sea–land interactions are complex, and
their interaction mechanisms are under continuous investigation. The coastal processes and their variability are driven by the interaction of waves, currents, winds,
and tides and their enormous forces that are applied on the bathymetry, causing massive changes in the coastal geomorphology by accreting or eroding the shoreline.
The sensing, monitoring, and modeling of such physical processes of coastal environments are crucial for the sustainable development of coastal regions and effective
management of the available land and water resources.
The acquisition of the appropriate data is essential but challenging, as the spatial
extent of the coastal phenomena varies from centimeters to kilometers, and the time
scale of the processes varies from milliseconds to decades. An example of the interaction of the phenomena is illustrated in Figure 3.1 for Sylt, a barrier island in North
Sea. The general practice has proven that a coastal monitoring system works well
3.6 Applications and Applicability of DiSC ......................................................... 57
3.7 Conclusions ..................................................................................................... 57
Acknowledgment ..................................................................................................... 59
References ................................................................................................................ 59
Tidal basin
Tidal Delta
Tidal basin
Inc
om
ing
wa
ve
fiel
d
Breaking bars
North Sea
R e s i d u a l m o t i o n
5
10
1 5
5
5
5
1
0
Inlet
15
15
5
5
10
DK
DK
D
Radar & Weather St.
Tidal gauge
Wave rider
0
10000
20000
3445000
6085000
6100000
Northing [m]
Easting [m]
6115000
3460000
3475000
FIGURE 3.1 Bathymetry and synergy of the hydrodynamic processes in the area of investigation. Symbols mark the position of the instruments during the experiment. The dashed
square demonstrates the coverage area of the radar.